Last Updated on April 15, 2025 by Owen McGab Enaohwo

Do you think an organizational chart for a small team is unnecessary? Well, you may want to reconsider because even small teams need clarification in their roles. An organizational chart can help eliminate confusion regarding responsibilities, which ultimately leads to missed deadlines and duplicate work. This relieves stress and increases productivity for the team in the end.
Your business has grown, amazing new talent has been brought on, and everything is going well until it is not. Now communication gaps arise and responsibilities become hazy. Does that resonate? You’re just like everyone else.
This is one of the many reasons a well-defined org chart will be an asset. This is not about being boxed in behind a hierarchy. Just to clarify — an effective organizational chart acts as a map of who is doing what in your business and how all the people are connected.
An organizational chart provides you with the leverage of not being a chaotic free-for-all by ensuring you enjoy the eventual benefit of a cohesive team. You may be wondering, “Will a company organizational chart work for my business?” If you want to move closer to improved communication and see better decision-making by a clear team with a purpose, then yes.
With SweetProcess, you will be able to create and maintain your organizational chart with more ease than ever.
It’s not just an organizational chart maker, it’s also a workflow automation and a process documentation tool to streamline all of your processes to better fit your workflows. Try SweetProcess for free today.
Table of Contents
What Is an Organizational Chart?
How Organizational Charts Are Used in a Company
Types of Organizational Charts
How To Create an Organizational Chart: A Step-by-Step Guide
How To Improve Your Organizational Structure Using SweetProcess
7 Organizational Chart Examples To Inspire Your Team
Best Practices & Tips for Creating a Functional Organizational Chart
Common Errors To Avoid When Creating an Organizational Chart
Streamline Your Organizational Structure With SweetProcess
What Is an Organizational Chart?

An organizational chart is a graphical representation that outlines your organization’s internal structure. It can be thought of as a snapshot of your organization or team that defines roles, responsibilities, and reporting relationships.
Organizational charts are represented as a flow chart to represent the relationships between departments, team members, and overall hierarchy in your business organizational structure.
An effective organizational structure can clarify roles and responsibilities for communication and authority and make it easier for employees to understand their place within the business. For example, a vice president will invariably fall directly below the president or chief executive officer (CEO) on the chart, which implies that the former is under the authority of the latter.
In design, organizational charts use simple symbols such as lines, squares, and circles to connect different job titles that are interrelated. This representation is important for clarity so that employees better understand their roles and how their work contributes to the bigger picture.
Interestingly, the first examples of the modern organizational chart are believed to be the work of Daniel McCallum, a railway superintendent who created an org chart to visualize the hierarchy of the New York and Erie Railway in the 19th century.
This history is a reminder that clarity is a powerful tool. An org chart helps eliminate confusion, promote communication, and add structure to decision-making. An organizational chart is a helpful tool for all organizations, regardless of size.
From a practical standpoint, most organizations use an organisational chart for the onboarding process of new employees to clarify communication, facilitate decision-making, and provide organizational information to manage projects.
Interested in creating an effective organizational chart for your business?
How Organizational Charts Are Used in a Company

Visual Communication
At its most basic level, an organizational chart is a diagram that shows the company structure. Organizational charts provide a clear snapshot of the organization by showing the hierarchy and how jobs relate. This makes complex relationships easy to understand. This visual clarity helps employees, stakeholders, and even outside parties easily understand how the company is structured and how different teams fit in. This is handy for new employees, who can see the company layout right away. For example, a retail business might use an org chart to show how store managers report to area managers, which aids in training.
Clarifying Roles and Responsibilities

Role clarity is vital. An organizational chart clarifies each person’s job and to whom they report. For example, an ad agency can show that the graphic designer falls under the creative lead, who falls under the marketing director. This avoids confusion, keeps teams on task, and moves projects along. Take an ad agency, for example. The chart can show that the graphic designer falls under the creative lead, who falls under the marketing director. No more “I thought you were doing that campaign” moments. As Dave Schoenbeck once emphasized, proactive organizational design is key for small businesses aiming for clarity and efficiency.
Decision-Making Support
The organizational structure of a business simplifies the decision-making process, as it is so well defined. It delineates who has decision-making authority in each department. Say in a tech startup resolving a problem, the developer reports to the team lead, who can ask the Chief Technology Officer (CTO) if needed. This speeds things up and maintains order. This formal escalation process helps to ensure timely issue resolution and operational efficacy.
Planning and Development

Expansion-focused businesses use organizational charts as strategic planning instruments for growth and expansion. It gives a view of resources and personnel. By viewing the current structure, decision-makers can spot gaps or problems. It also shows career progression paths. Organizational charts can be used by human resources (HR) departments to map out succession planning so that key positions have talent pools identified for future succession. Steve Jobs demonstrated similarly with Apple’s centralized structure which further explains how a well-structured org chart can drive innovation by keeping the chain of command clear and agile.
Types of Organizational Charts
1. Hierarchical
This is a common business organizational chart. The chain of command goes from the top down. This is a pyramid structure, with the CEO at the top. Then come vice presidents, managers, and employees. It shows a clear chain of command. Large companies use this. For example, Amazon has Jeff Bezos at the top. Then, senior vice presidents for retail, technology, and more, each with their own teams.
Pros:
- Clear authority—everyone knows who their boss is.
- Simple and easy to understand.
Cons:
- Can be rigid and slow to adapt to changes due to multiple levels.
- May feel bureaucratic with too many layers causing delays.
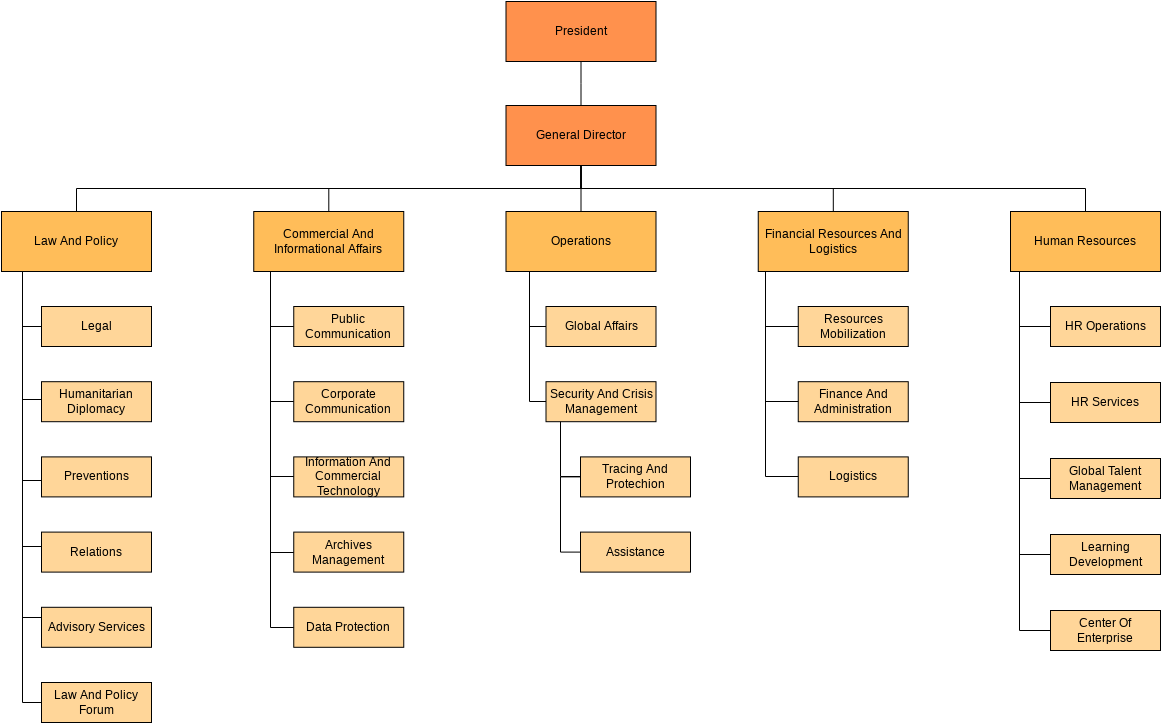
2. Divisional
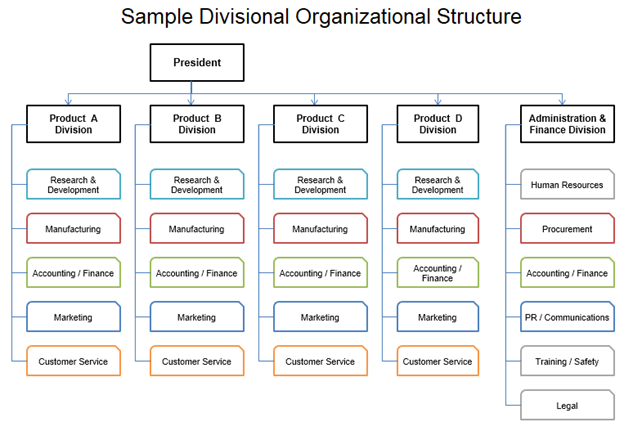
Divisional org charts structure companies by products, markets, or regions. Each division runs independently. The company splits into divisions, such as by-products (beauty, health) or regions (North America, Europe). Each division has its hierarchy. For example, Procter & Gamble has divisions for beauty and health care. Each has its own management.
Pros:
- Divisions focus on their market or product.
- Divisions develop expertise.
Cons:
- Duplication of resources, like separate HR for each division.
- Less teamwork across divisions.
3. Matrix
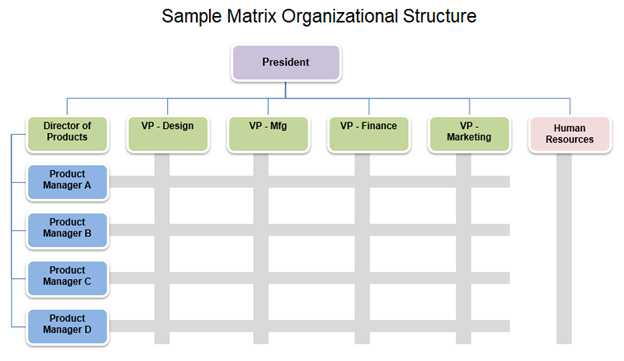
This combines functional and project-based structures. Employees report to a functional manager (e.g., head of engineering) and a project manager (e.g., for a specific product launch). A good example is a developer working on two projects, one with their team manager and another with a product manager. In this scenario, the matrix chart uses a grid to show relationships among these cross-functional teams.
Pros:
- Encourages cross-functional collaboration, which is great for projects needing diverse skills.
- Flexible and can adapt quickly to new initiatives.
Cons:
- Can be confusing for employees with multiple bosses and priorities.
- Complex to manage, potentially leading to conflicts between managers.
4. Flat
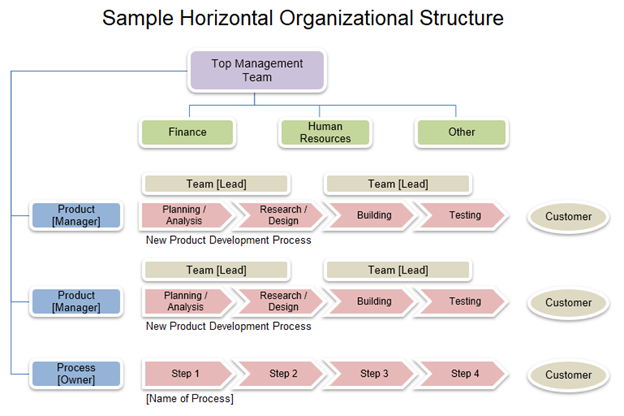
Flat organizations or horizontal organizational charts place employees at the center, cutting through the red tape of excessive management, empowering staff to make decisions quickly with minimal approval required. This structure is most commonly found within small businesses and startups. The flat organizational chart or horizontal structure consists of few or no middle managers between staff and executives. Zappos, the online apparel retailer, and Valve, a prominent video game developer, operate this type of organizational chart.
Pros:
- Flexible with quick decision-making and adaptability.
- Encourages innovation and risk-taking, which is great for creative teams.
- Increased employee autonomy and engagement.
Cons:
- Lacks clear direction, can lead to confusion about roles and responsibilities, and may not scale well as the company grows larger.
- Leads to potential overload for team leaders and limited career progression opportunities for employees.
Understanding the type of organizational chart that best fits your business is crucial for effective management.
How To Create an Organizational Chart: A Step-by-Step Guide

1. Identify Roles and Responsibilities

The first step in creating organizational charts is to identify roles and responsibilities within the organization. Start by listing all positions in your company, including full-time, part-time, and key contractors. For each role, define what they do to ensure there are no overlaps or gaps. For example, in a small café, you might list the owner, manager, baristas, and cleaners, each with clear duties like managing finances or serving customers.
2. Structure the Hierarchy
Decide on the type of structure that fits your business, such as hierarchical (clear chain of command), divisional (by product or region), matrix (dual reporting), or flat (fewer levels). Choose based on your size and industry; a flat structure might suit a startup, while a growing e-commerce business might need hierarchical layers. Choose the structure based on factors like company size, products or services, market, and desired level of control.
3. Visualize Relationships and Reporting Lines

Once functions have been identified and the organization’s structure determined, lay out who reports to whom. In a hierarchical organization, it’s simple: one person per boss, indicated by an arrow from the employee’s box to the boss’s box. In a matrix organizational structure, individuals may report to multiple bosses, indicated by arrows to functional and project bosses. The chart should be easy to read with understandable labels and a logical layout, most often top to bottom or left to right, with the use of tools like SweetProcess for ease.
4. Keep It Updated
Keep the organizational chart up to date. Do this as the business grows or changes. Read and update it from time to time. Assign someone to update and select a schedule, for example, monthly or quarterly updates. Update when there is a major change and let the team know about these changes so that everyone is on the same page. For solutions like SweetProcess, updating is easy and very simple.
How To Improve Your Organizational Structure Using SweetProcess

SweetProcess offers an intuitive, robust solution to easily create and customize organizational charts tailored to your business’s specific needs. Here is how:
Document Your Organization’s Procedures and Processes.
Is our business facing a major challenge due to a lack of effective process documentation and tribal knowledge? SweetProcess allows users to document processes and procedures using both manual and AI tools, SweetAI, which can generate all kinds of content in seconds and supports multimedia elements such as texts, videos, and charts. To create a procedure in SweetProcess, follow these steps:
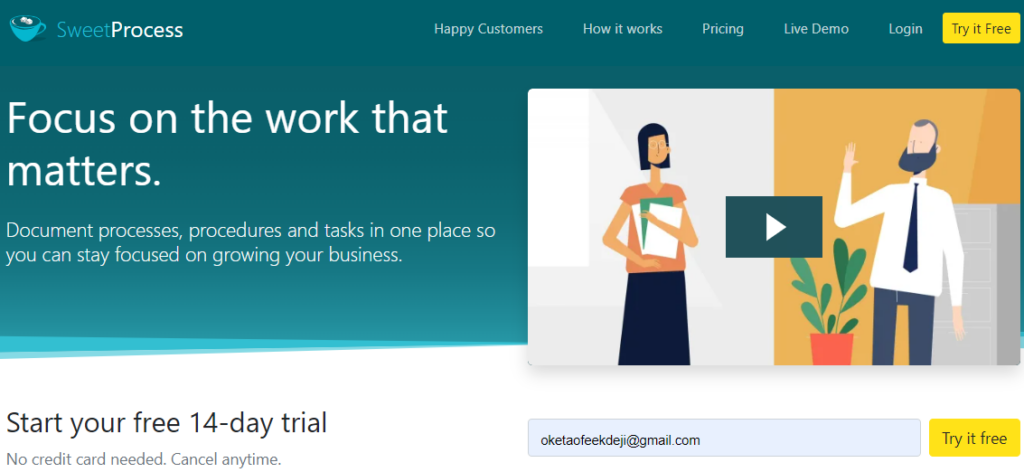
Sign up at sweetprocess.com to enjoy a 14-day free trial with no credit card needed.
Creating a Process Using SweetProcess
Next, log in to your SweetProcess account and click on the “Procedures” tab on the main menu.
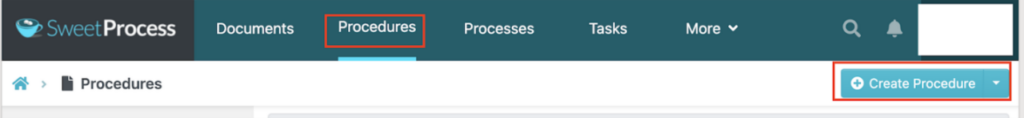
- Select “Create Procedure” on the next tab and add a procedure title.
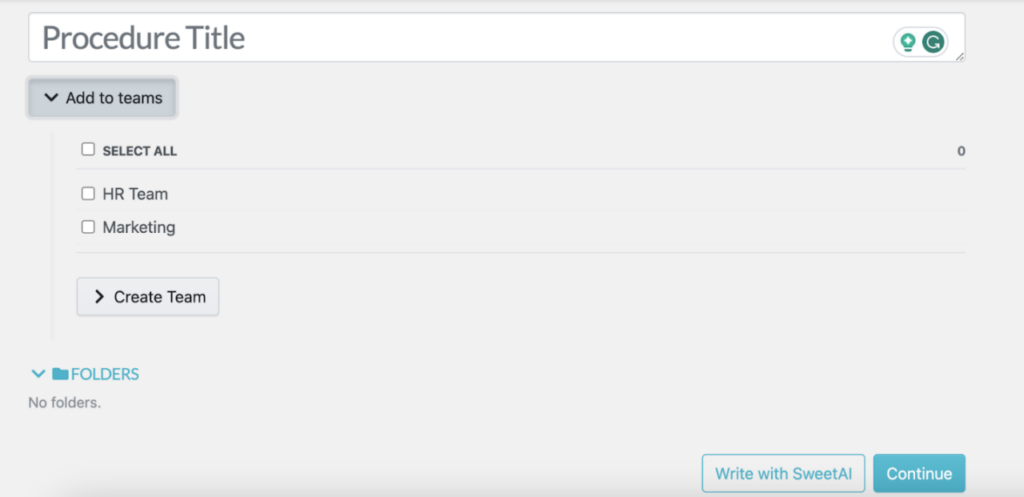
- Assign the procedure to specific teams by selecting an existing team or creating a new one.
- Choose to write the procedure manually or use SweetAI for assistance.
- Add relevant details to complete your procedure.
Creating a Process Using SweetProcess
To use SweetProcess for process management, here’s how to get started:
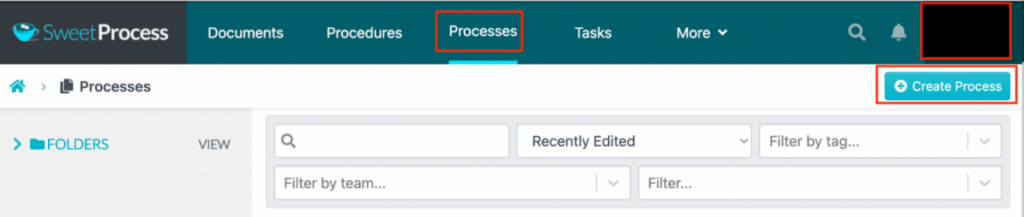
- Go to the “Processes” tab in the main menu and click on “Create Process” to begin setting up your process.
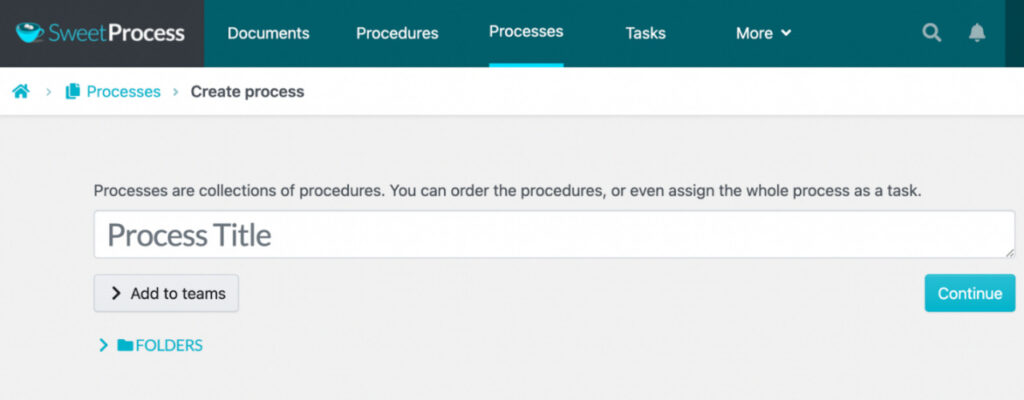
- On the next tab, add the title.
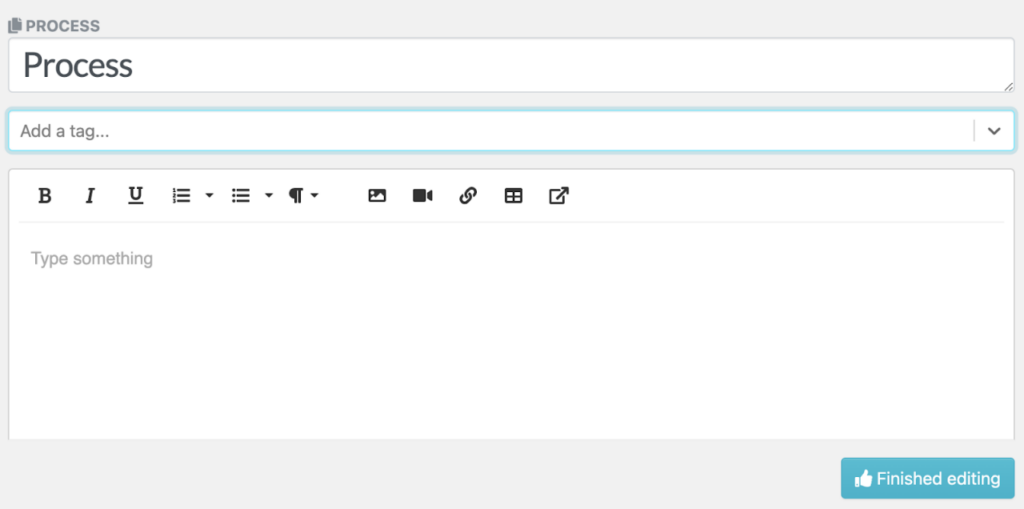
Next, include all the necessary details about the process to support training. You can add images, tags, and videos to make the process clear and thorough.
Create Up-to-date Policies for Your Organization
Feeling stretched with the need to create a new policy, update existing? Need help communicating your ideas effectively and bringing clarity to the chaos? Fear not, Sweetprocess offers comprehensive solutions for policy management, process documentation, and business management. This functionality comes in both manual and AI-assisted policy creation. Here is how;
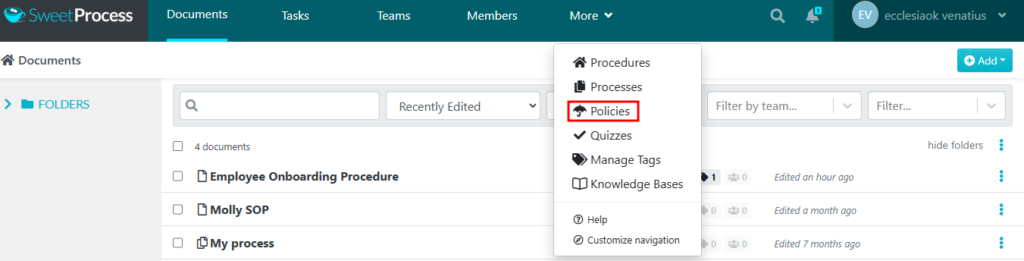
A. On the SweetProcess homepage, click the “More”drop-down button and select “Policies.”
B. Next step,
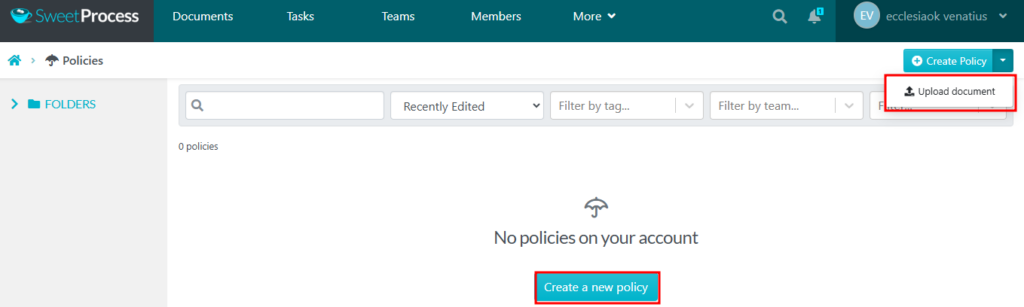
- Click the “Create a new policy” button to create your policy from scratch.
- Or click the drop-down button at the top-right corner (beside “Create Policy”) and click on “Upload document” if you already have your policy in a Word document (.DOCX).
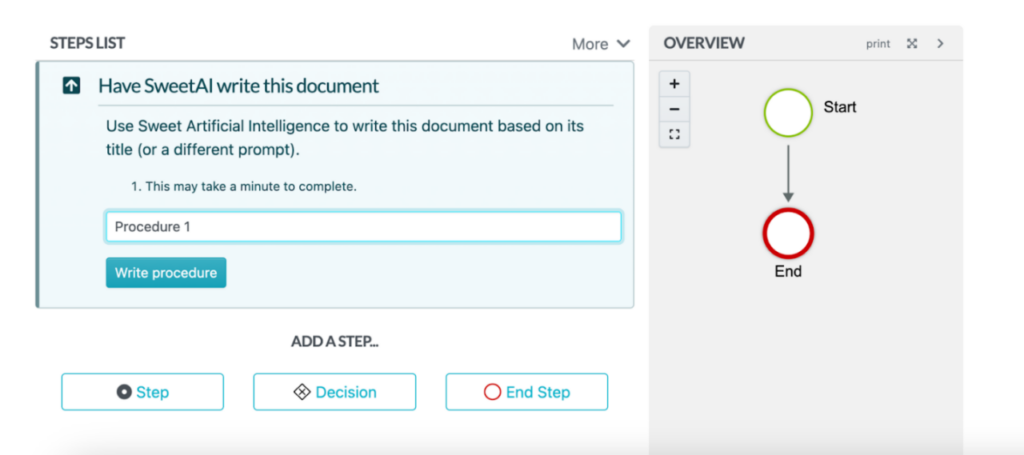
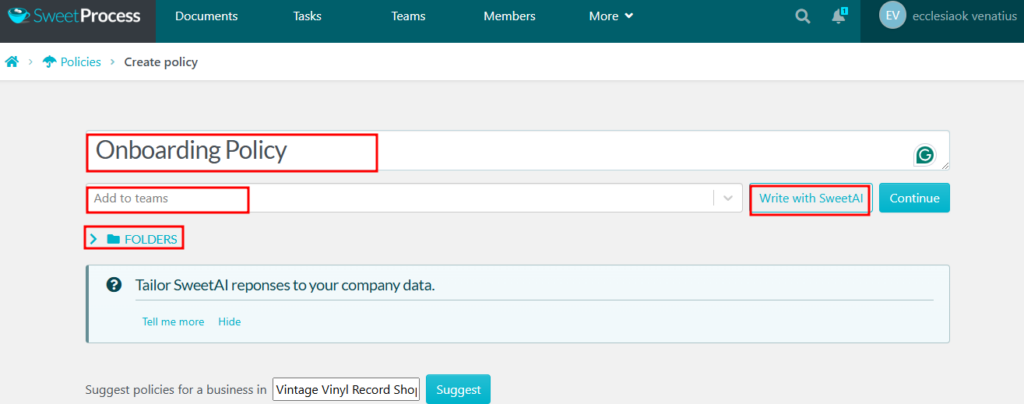
C. Next is to enter your policy title and add the policy to teams and folders. Next, click on “Continue” to get to the editor or use SweetAI to write the document based on the title you provided. Also, you can use SweetAI to suggest policies for business options.
D(i). If you use SweetAI to write your policy, you get something like this (generated based on the title “Recruiting”:
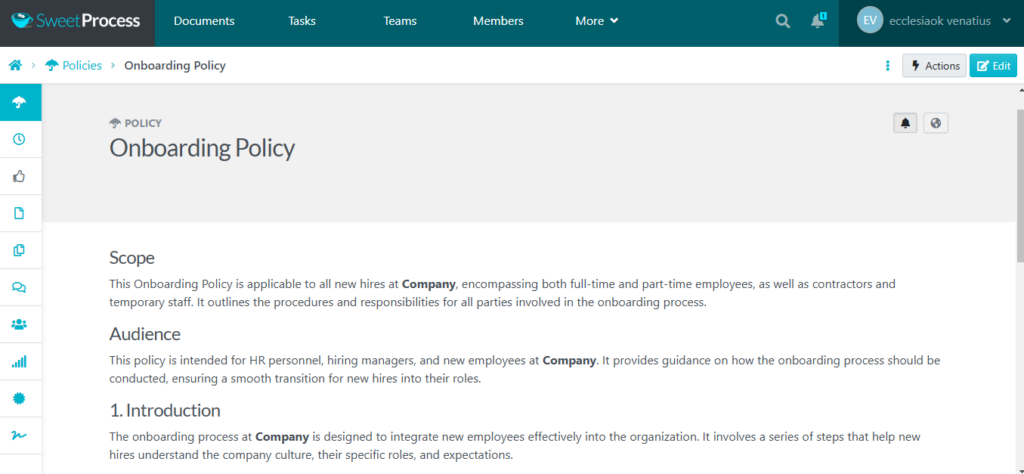
D(ii). Otherwise, if you click “Continue” instead, you’ll be taken to the policy page, where you can edit the policy to add content.
On the policy page, you’ll see a prompt offering SweetAI’s assistance in drafting your policy. This option is perfect if you don’t have content ready yet—simply fill in the blanks of the AI-generated draft.
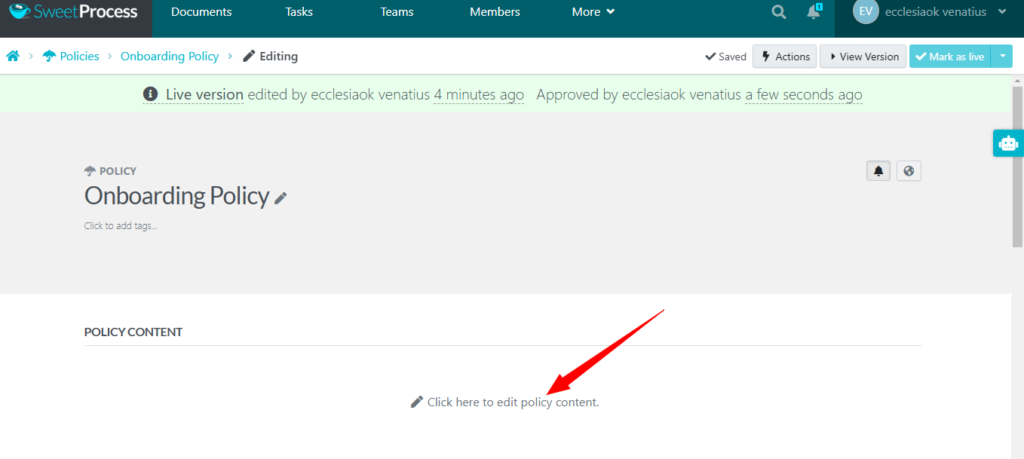
E. However, if you already have your policy content, you can skip the prompt.
F. Just click “Click here to edit policy content” to open the editor and write or paste your content directly.
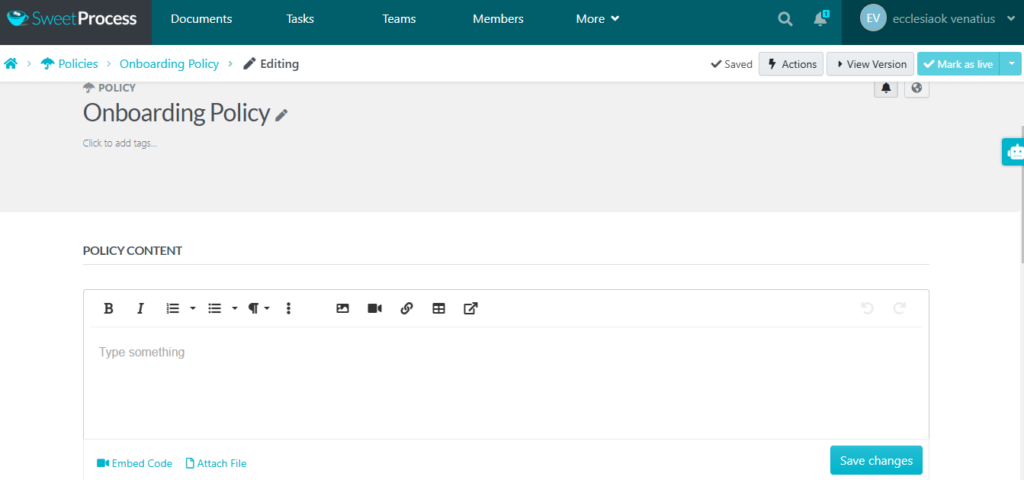
In the editor, you can enhance your policy by adding pictures, videos, links, and tables. You can embed a video directly on the page or attach an external file to give more context.
G. Once you’re satisfied with the content, click the “Save changes” button to save your work.
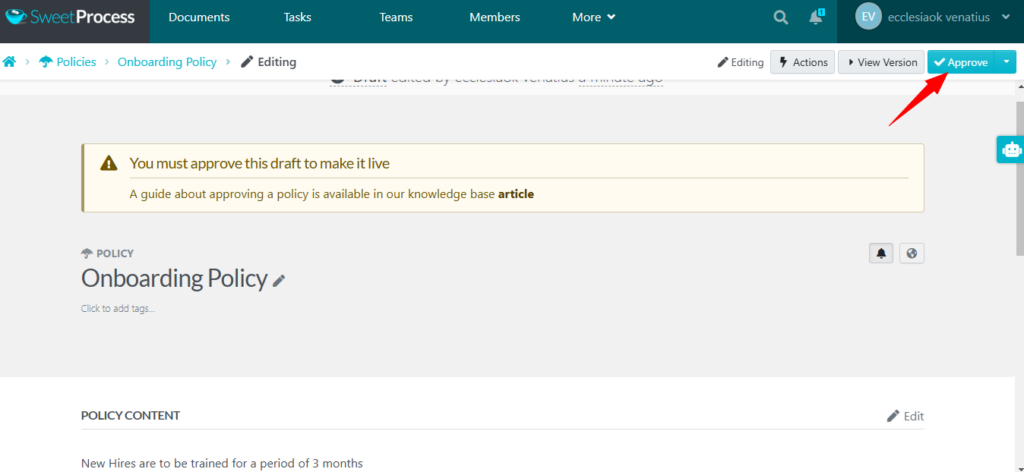
H. The new policy needs to be approved and finalized. Just click the “Approve” button at the top-right corner of the screen.
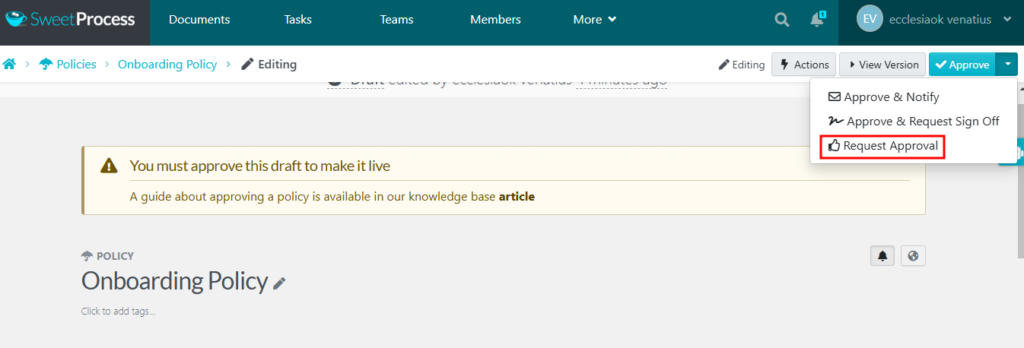
You can approve the draft automatically if you’re a team manager or super manager. If you’re not, you’ll need to request approval. The person with the appropriate authority can then access the policy and give the final approval.
Following these processes, you can manage your business policies in SweetProcess. After saving your policy in SweetProcess, managing it is straightforward. To edit, share, duplicate, export, or delete a document, click the three dots next to the process name and select the necessary action.
Assign Procedures and Processes as Tasks To Team Members
Managing large teams or complicated processes and procedures with many moving parts can be overwhelming for any business. Assigning a procedure or process as a task to teams is a great way to ensure work is done consistently and tracked effectively. SweetProcess simplifies task management, making creating, assigning, and tracking tasks easy, ensuring everything runs smoothly. It helps businesses, especially startups, keep operations smooth by following a set of steps:
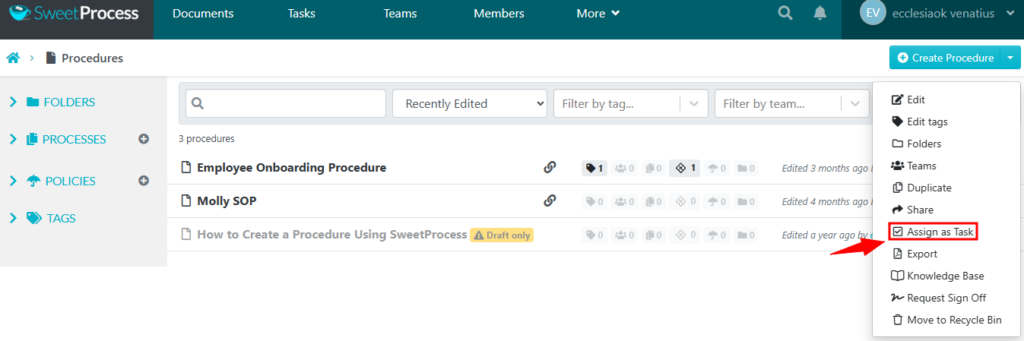
A. Select “Assign as Task”
On the SweetProcess dashboard, select the three dots menu to the right of the procedure or process you want to assign
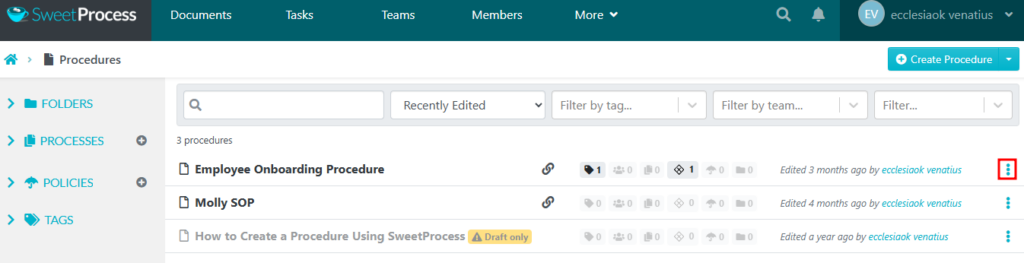
Inside the three dots menu, click the option for ”Assign as Task.”
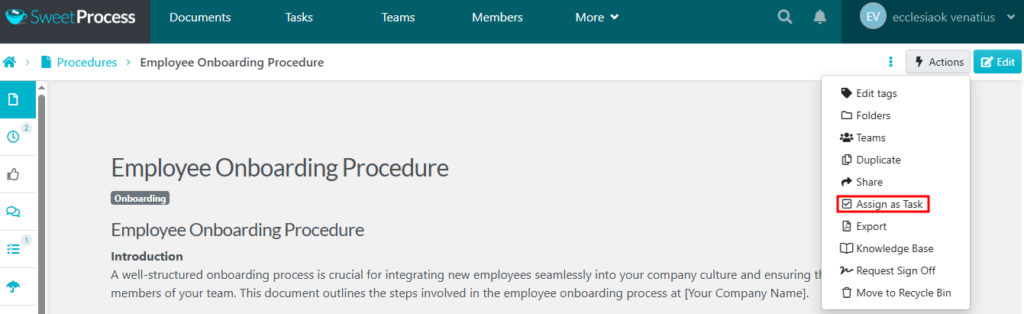
Also, you can assign a task while at the procedure or process itself from the ”Actions”menu on the top right of the screen:
B. Single or Multiple Tasks?
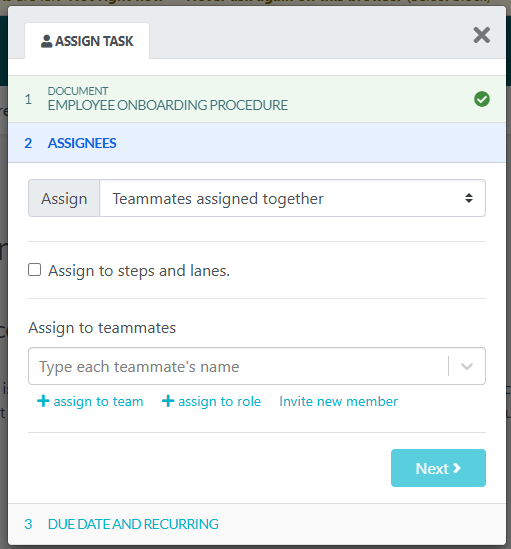
You can assign a single task for a group to work on together or multiple tasks individually to each teammate (bulk assignment). Select the teammates you want to assign tasks to, or assign them to an entire team or specific roles. Depending on your choice, they will either collaborate on one task or receive separate assignments.
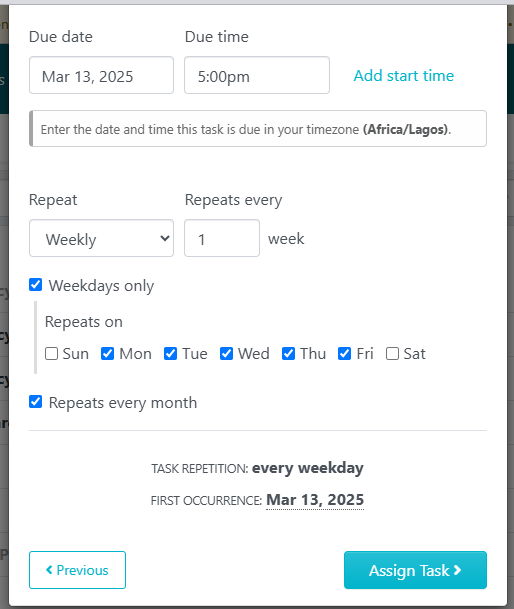
C. Fill Out the Rest of the Task
The task name helps distinguish it from similar ones.
You can adjust:
- Due date
- Start time (teammates get notified then or on the due date if none is set)
- Early start permission to prevent premature completion
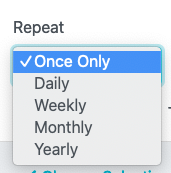
- Repetition (custom or basic: weekly, monthly, yearly)
D. Repeating Tasks:
By default, tasks are set to “Once Only” for one time completion. However, many tasks need to be repeated daily, weekly, monthly, or yearly. Choose from various repetition rules by selecting a different option in the “Repeat” drop-down.
E. Assign the Task!
Go ahead and assign it. Assigned teammates will get a notification now and a reminder email on the due date. They’ll also be notified of the start time or when the task is due.
You’ll be notified if the task is overdue or when it’s completed.
Collaborate Seamlessly With Team Members
Does your business growth and expansion threaten collaboration among your teams? SweetProcess helps document tasks and ensure employees have easy access to critical information by converting your procedures into bit-by-bit tasks with clear ownership and deadlines. Here’s how to collaborate effectively with other team members:
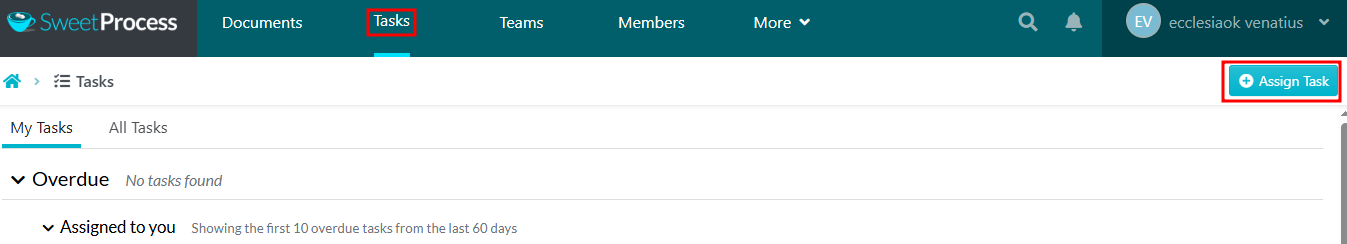
A. Navigate to the “Tasks” tab on your dashboard. Click the “Assign Task” button located on the right-hand side.
Enter Task Details:
- Name
- Description
- Due date
- Frequency
- Priority
Assign it to the right team member, then click “Save” or “Assign Task” to finalize.
Only SweetProcess users with manager access can assign tasks. To allow teammates to assign tasks, adjust their permissions.
The Texas Department of Family and Protective Services, a government agency, faced a challenge of ensuring efficiency in its workflow. Having used several tools like SharePoint, Microsoft Word, and Excel Spreadsheet, they realized that basic workflow solutions were insufficient for their kind of work.
DFPS implemented SweetProcess, a workflow management tool, to solve this. SweetProcess helped them to streamline their operations and become more efficient as an agency.
“We, over time, have had many big projects to overhaul all our manuals, and then we got to a place where we just could not update it fast enough. To get the ETA done was like a year because it was just so much. It was three separate manuals that had certain points of overlap, and it all had to be reviewed by someone. We didn’t have a perfect way to get that done.” – Heather MacLean
MiPA, is another small business that has been in operation for over 10 years, faced challenges in scaling its operations. Relying on word of mouth and minimal marketing, they needed a better way to streamline their processes and improve efficiency.
To solve this, MiPA implemented SweetProcess, a workflow management tool. With SweetProcess, they could track and monitor workflows more effectively, saving time and delivering better service to customers. SweetProcess also helped in documenting their processes, and training new employees.
“By the nature of what we do, we are carrying out lots of bespoke things for different businesses. It’s not just like we have one product and it’s done exactly the same way…. We have like 350, 400 customers now. SweetProcess has helped us to really scale up our service in a bespoke way. It’s enabled us to serve people in the way that they particularly want.” – Emma Mill, Founder of MiPA
7 Organizational Chart Examples To Inspire Your Team
1. Technology Org Chart Example
Many tech firms use matrix or flat structures. They show roles like the CTO, product managers, developers, quality assurance engineers, and user experience and user interface designers. For example, a small tech startup might use a simple chart. It shows a CTO at the top, then development, operations, and support teams. Google is an example. Sundar Pichai is the CEO. Senior vice presidents oversee Search, Ads, and YouTube. A good tech org chart defines roles. This helps teams stay agile and efficient.
2. Marketing Organizational Structure Example
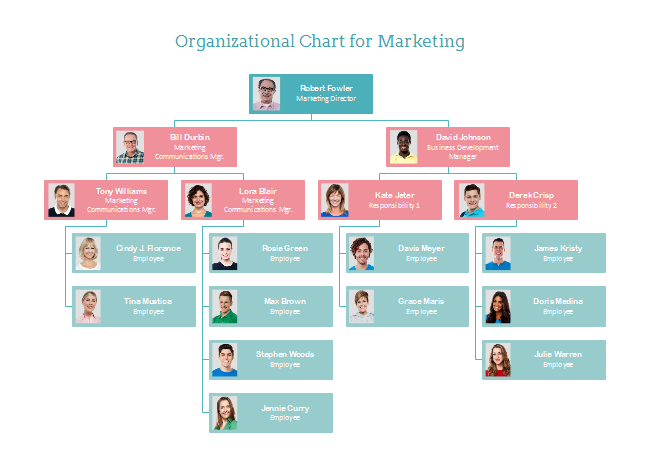
A marketing org chart often has a chief marketing officer (CMO). Teams focus on brand management, digital marketing (search engine optimization, search engine marketing, social media), content creation, analytics, and customer experience. Modern structures link customer steps to campaigns. HubSpot organizes its marketing team by customer steps—awareness, consideration, and decision-making.
3. Nonprofit Org Chart Example
Nonprofit org charts often show an executive director or CEO. They report to a board of directors. Roles include program managers, development managers, volunteer coordinators, and communications specialists. Volunteers and committees support projects. The Red Cross is an example. An executive director oversees disaster relief and volunteers, guided by a board.
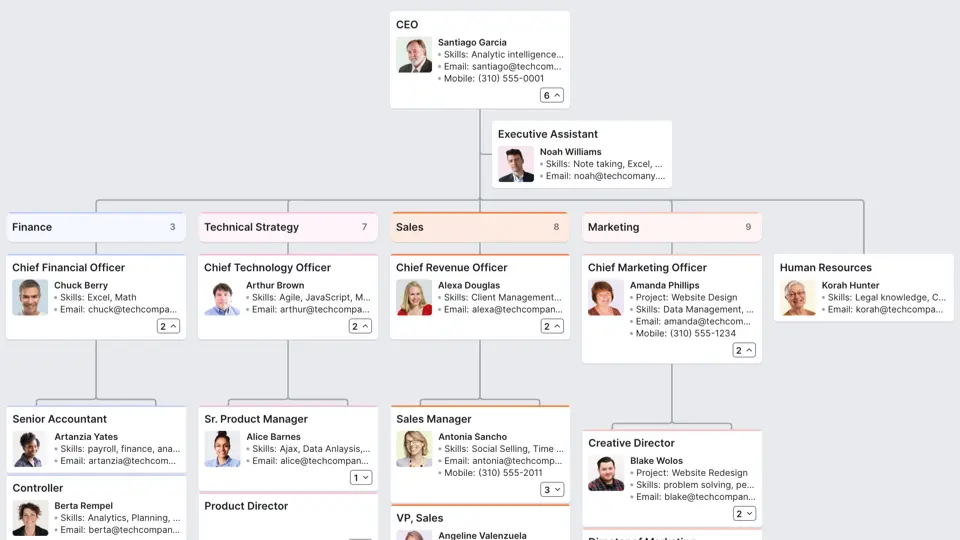
4. Leadership Organizational Chart Example

Leadership org charts focus on an organization’s top-level executive structure. They typically include the CEO or president and C-suite roles (Chief Financial Officer (CFO), Chief Operating Officer (COO), Chief Marketing Officer (CMO), Chief Technology Officer (CTO)) and sometimes extend to vice presidents or directors. These charts emphasize reporting relationships and decision-making authority at the highest levels of the entire organization. Amazon organizes its leadership team around business units (Amazon Web Services (AWS), consumer, etc.) with strong centralized functions.
5. Accountability Org Chart Example
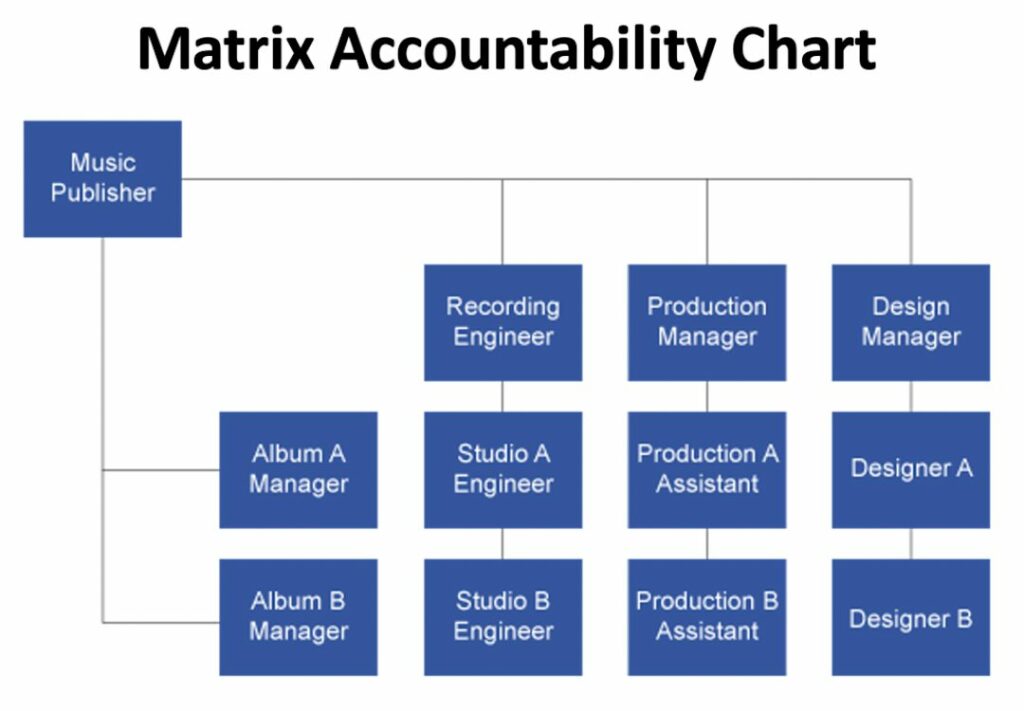
An accountability org chart emphasizes roles that ensure performance tracking, featuring team leads, supervisors, and performance managers. Companies implementing the entrepreneurial operating system (EOS) use Accountability Charts rather than traditional org charts. These define core functions and the specific, measurable outcomes for which each person is accountable. Project management organizations like Asana structure their teams around clear deliverable ownership rather than just reporting relationships.
6. HR Department Org Chart Example
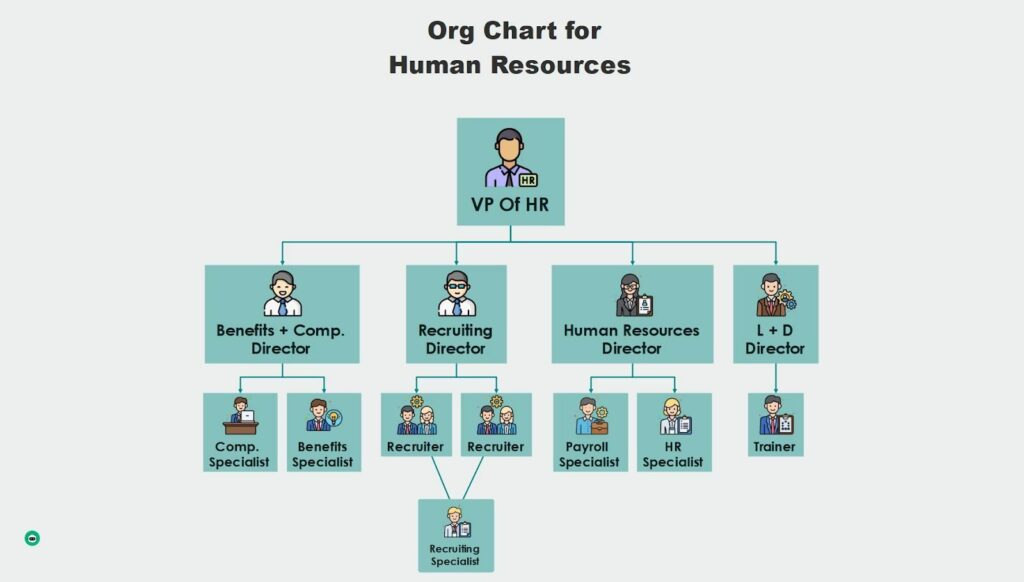
HR department organizational charts typically feature the chief human resources officer (CHRO) or HR director at the top, with specialized functions beneath. Common departments include talent acquisition (recruiting), learning and development, compensation and benefits, and employee relations. IBM structures its HR function with both centralized expertise (global compensation strategy) and embedded HR business partners who support specific business units.
7. Healthcare Organizational Chart Example
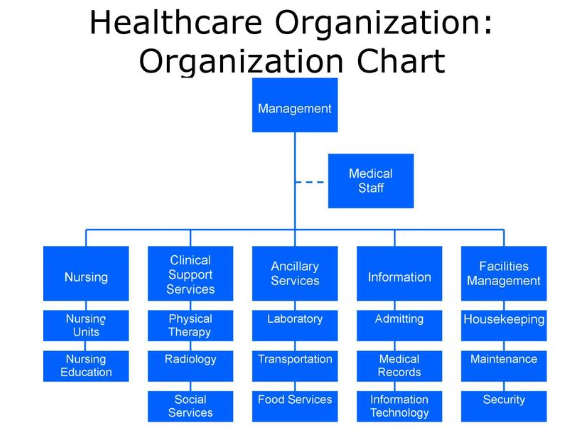
Healthcare org charts are designed to address the complex needs of medical facilities, featuring roles like the chief medical officer, department heads, physicians, nurses, technicians, and administrative staff. Mayo Clinic organizes integrated practice units that bring together all professionals involved in treating specific medical conditions. Cleveland Clinic structures its organization around patient-centered institutes (heart and vascular, neurological, etc.) rather than traditional medical departments.
Best Practices & Tips for Creating a Functional Organizational Chart
Break Down Your Org Chart Into Manageable Pieces
When making an organizational chart, break it into pieces. Make charts for each team. Then, complement the chart with detailed process documentation using tools like SweetProcess.
With SweetProcess, you can document standard operating procedures (SOPs), ensuring team members understand their roles and tasks and enhancing the chart’s functionality. To create the org chart itself, consider online tools like Canva, SmartDraw, or Lucidchart. After creation, use SweetProcess to document processes, linking them to each department for a comprehensive view.
Make Groupings Sensible
Group jobs in ways that make sense. Group by job type (finance), location (regions), or products. The best way is to group the work according to how it is done and use process tools like SweetProcess. While SweetProcess itself isn’t directly used for grouping, it helps find groups based on work processes. This makes the org chart match how work is done. This not only keeps your chart clear and updated but also ensures that every team member understands their role.
Use an Online Org Chart Maker
Online org chart makers, such as Canva, SmartDraw, or Lucidchart, can save a lot of time and effort. These tools provide an easy way to create and update charts with templates, drag-and-drop functionalities , and collaborative features, like other tools designed for founders juggling a lot of things at once. Once you have these tools to create the chart, you can embed process documentation from SweetProcess to provide a comprehensive view, linking each role to its procedures for enhanced clarity.
Use Colors or Shapes To Define Different Roles
Make your org charts easier to use for different departments to organize functions and roles by using colors or shapes to define functional or leadership roles. For example, blue could symbolize bosses, and green could symbolize staff. Squares can be for leaders and circles for team members. This approach allows the team to see roles, and an org chart template would be easy to use.
Don’t just draw boxes. Connect your organizational chart to real work.
Sign up for SweetProcess and streamline your team’s workflow.
Common Errors To Avoid When Creating an Organizational Chart
1. Neglecting To Update the Chart
One of the most frequent errors is not refreshing the organizational chart. This happens when there is no procedure for refreshing it or when it gets overlooked. An outdated chart can confuse employees on whom to report or who is responsible for certain tasks. It can also confuse new employees or external stakeholders who use the chart to view the organization’s structure and generate miscommunication and inefficiencies.
2. Overcomplicating the Structure
The second error is that the org chart is too complicated. This happens when businesses try to depict every nuance, making the chart cluttered and hard to read. A complicated organization can lead to inefficiency because many people can be engaged in making decisions, thus slowing down the process. It can also make it harder for individual employees to understand their place in the company and to whom they need to report, thus leading to delays and frustration.
3. Ignoring Cross-Functional Teams
Cross-functional teams exist in many organizations, where employees from various departments work on shared projects and assignments together. Failing to depict these teams on the organizational chart and how they align with the rest of the organizational structure is a mistake. If the chart merely depicts the hierarchy, it could fail to indicate how the work is accomplished, particularly in organizations where cross-functional teamwork is prevalent. This may lead to confusion regarding what people are doing and how different parts of the organization work together, and therefore, possibly hinder project growth and team cohesiveness.
With SweetProcess, you can access 15 Free Organizational Chart Templates. You can start using them today for your organization.
Streamline Your Organizational Structure With SweetProcess

An organizational chart is more than just some graphics indicating who reports to whom. It’s a useful asset for your business that indicates how your project team functions and ensures everyone understands their position. It facilitates communication and accelerates decision-making. Most businesses have outdated charts or complicated structures. They are losing all the benefits a quality org chart would provide. This is where SweetProcess comes in. SweetProcess offers the simplicity of creating and modifying your org chart. It connects your chart to your processes, procedures, and knowledge base. This lets your project team be aware of who does what and, more critically, how to do it.
Don’t let confusion slow your business down. Build a clear, effective organizational structure with SweetProcess. Start your free 14-day trial today and see the difference it makes.