Last Updated on March 28, 2025 by Owen McGab Enaohwo

Are you self-sabotaging your business? You may be if you don’t provide your employees with the tools they need to excel in today’s highly competitive business landscape.
With business process mapping, you can make it almost impossible for your employees to underperform. Don’t just tell them what to do—show them how. Here’s all the information you need.
SweetProcess is a software to create and manage business process maps. Sign up for a 14-day free trial without a credit card.
Table of Contents
What Is Business Process Mapping?
Benefits of Business Process Mapping
How to Create a Business Process Map
How to Create Business Process Maps in SweetProcess
Types of Business Process Maps
Best Practices and Tips for Business Process Mapping
Business Process Mapping Symbols and Notations
History of Business Process Mapping
Differences Between Business Process Mapping and Business Process Modeling
Empower Your Team for Success With Business Process Mapping
What Is Business Process Mapping?

Business process mapping is the visual representation of the steps for executing tasks. It relays how to perform activities for desired outcomes with a graph. The focus is on showing the movement of business processes instead of describing them in words.
We can liken a business process map to a geographical map—both are useful for direction. You can locate unfamiliar places with their maps if you are good at map reading. Business process mapping serves the same purpose in performing tasks by directing you on the next steps to take.
Flowcharts are an integral tool in business process mapping. You can use them to showcase activities in different dimensions, especially regarding movement. They are flexible for capturing numerous visual instructions at each process point.
Business process mapping isn’t only beneficial to task executors. It’s also a great tool for explaining concepts to stakeholders and customers so they understand the nuances of a business process. That way, getting their buy-ins, support, and approvals is easier when the need arises.
Benefits of Business Process Mapping

Business process mapping creates an enabling environment for employees and stakeholders to thrive by aligning their common goals. Here are some of its benefits.
Improve Employee Engagement and Satisfaction
Employees are responsible for excelling at work. Failure to do this impacts the workflow and output negatively. Keeping them engaged and satisfied positions them to be at their best. There’s little or no engagement when they are confused about their tasks. This confusion leads to dissatisfaction and underperformance.
Process mapping picks their interest by visualizing their roles, tasks, and how to execute them. A clear picture of their responsibilities heightens their engagement and ultimately results in satisfaction.
Spot Vague Problems Easily
Most work instructions look great on paper with the right words and grammar, but you may find that they aren’t practical when it’s time for implementation. There’s a tendency to have blindspots when you write processes, resulting in bottlenecks that aren’t obvious but hinder performance.
Visualizing tasks with process mapping lays out all aspects on the table. When something doesn’t look as good as you anticipated it, you can trace the sources on the map. It eradicates guesses and assumptions, allowing you to tackle challenges from their root causes for lasting solutions.
Cultivate Uniformity in Employee Performance
When you ask people to perform the same task independently without any guidance, rest assured that you will get different results. Even if they deliver good results, the lack of uniformity isn’t sustainable and will negatively affect your business in the long run.
Work teams perform best when they operate with established guidelines. Members have a shared experience using a process map, allowing them to interact and bond. There’s also consistency in operations across the organization, even when people perform tasks individually.
Increase Customer Satisfaction
Customer satisfaction is an end product of employee performance. Customers are unsatisfied if service providers underperform. Sustainability is essential for customer satisfaction. Having identified the most effective ways to meet their needs, you must sustain it lest you lose their trust.
Business process mapping increases employee competence by providing the information and direction to deliver quality results. Since such high performance doesn’t depend on their knowledge, they’ll continuously satisfy your customers by consulting the map.
Automate Low-Value Processes
All business processes drive the workflow, but some are more significant than others. Prioritizing the less important activities is a disservice to your business—you may be guilty of this without realizing it.
Business process mapping outlines the value of each activity in your operations and guides you to prioritize your most valuable assets. The goal isn’t to abandon low-value processes but to automate them to work with little or no manual input. Such a balance facilitates effective business process management where you nurture the current process for repeatable and sustainable success.
Improve Compliance Levels
Businesses don’t operate in a vacuum but in societies with regulations. As a business operator, you must abide by established regulations in your industry or suffer sanctions.
An organization’s regulatory compliance level is an offshoot of its actions and inactions—this is usually reflected in its business processes. Visualizing tasks with business process mapping makes it easier to be compliant in highly regulated industries as workers operate by the books with clear guidance.
Document Tribal Knowledge
The best practices in an organization are sometimes restricted to a select few. An employer could discover hacks for complex tasks by being in a particular role for a long time. But this knowledge stays with them—others can’t implement tasks requiring such knowledge in their absence to the detriment of the business.
Business process mapping is a good opportunity to document valuable work instructions that some employees are privy to. It shows how to perform the tasks so others can implement them independently.
Remove Redundancy
Redundancies in the workflow elongate turnaround times and waste resources. Visually showcasing steps with a process mapping tool highlight overlapping steps. You can remove them and close any gaps for higher performance.
Cutting down unnecessary steps with business process mapping provides more time and resources for areas needing improvement. Doing this continuously creates an effective workflow with little or no bottlenecks.
How to Create a Business Process Map

Creating an effective business process map involves the following procedures:
Identify a Problem or Process to Map
A process map addresses a specific task—you must identify the task before commencing work. Adopting a problem-and-solution perspective helps create maps covering all aspects of a task. Outline a specific gap in your workflow and seek ways to close it.
The process could be a completely new one to address a rising need or an existing one already part of your workflow. If it’s the latter, your goal is to improve it.
Outline the Human Tasks
It is counterproductive to group all the tasks in the entire process under one umbrella. Separate human tasks from other tasks, and make notes on why people must perform those tasks for clarity.
There’s a tendency to assume that others understand the task as much as you do. Imagine you are directing a novice. Outline each step to get rid of any confusion. Liaise with team members who execute the tasks for first-hand information.
Identify where each task starts and ends and establish smooth handoffs to prevent bottlenecks.
Outline System-Based Tasks
The next step is to identify the tasks that are better performed by machines. This is where you automate routine and straightforward tasks. Since such activities require little or no engagement, they can run on autopilot while humans focus on the more engaging ones.
Establish the Sequence
Most workplace tasks have a sequential order—this must be reflected in your process map. It’s your duty to perfect the arrangement in the creation process. Measure the gaps between each activity and the required time, as too many delays could cause setbacks.
Are there any steps people need to perform simultaneously? Capture that on the map, too.
Identify Redundancies
Take a closer look at the steps in your sequence to identify redundancies. An effective way to do this is to run the process flow without each step. If you can perform the task without any of the steps, you might as well remove it.
Draw a Flowchart With Process Mapping Symbols
Visualization is a major component of process mapping. To make your process visual, capture its steps in a flowchart. Use standard process mapping symbols to communicate the actions users need to take at each point. Familiarize yourself with the symbols so you don’t mislead people.
Finalize and Share the Process Map
Don’t be in a hurry to publish your process map as an official document. Share it with other team members and stakeholders to get their feedback and input. Part of your objectives at this stage is to know if people understand the message you are conveying. Implement useful feedback into the final document.
Monitor the Task for Improvement
Pay attention to your performance when implementing the workflow process map. You may notice some areas to improve on over time. This is inevitable as your business terrain changes over time. Adjust the map to meet your emerging needs.
How to Create Business Process Maps in SweetProcess
Creating a dormant business process map is a waste of valuable resources. If people aren’t using it, it’s probably not helpful to them. SweetProcess’s intuitive design interface simplifies process documentation and mapping. It’s easy to create processes, generate process maps, and manage your processes.
How to Create a Process in SweetProcess.
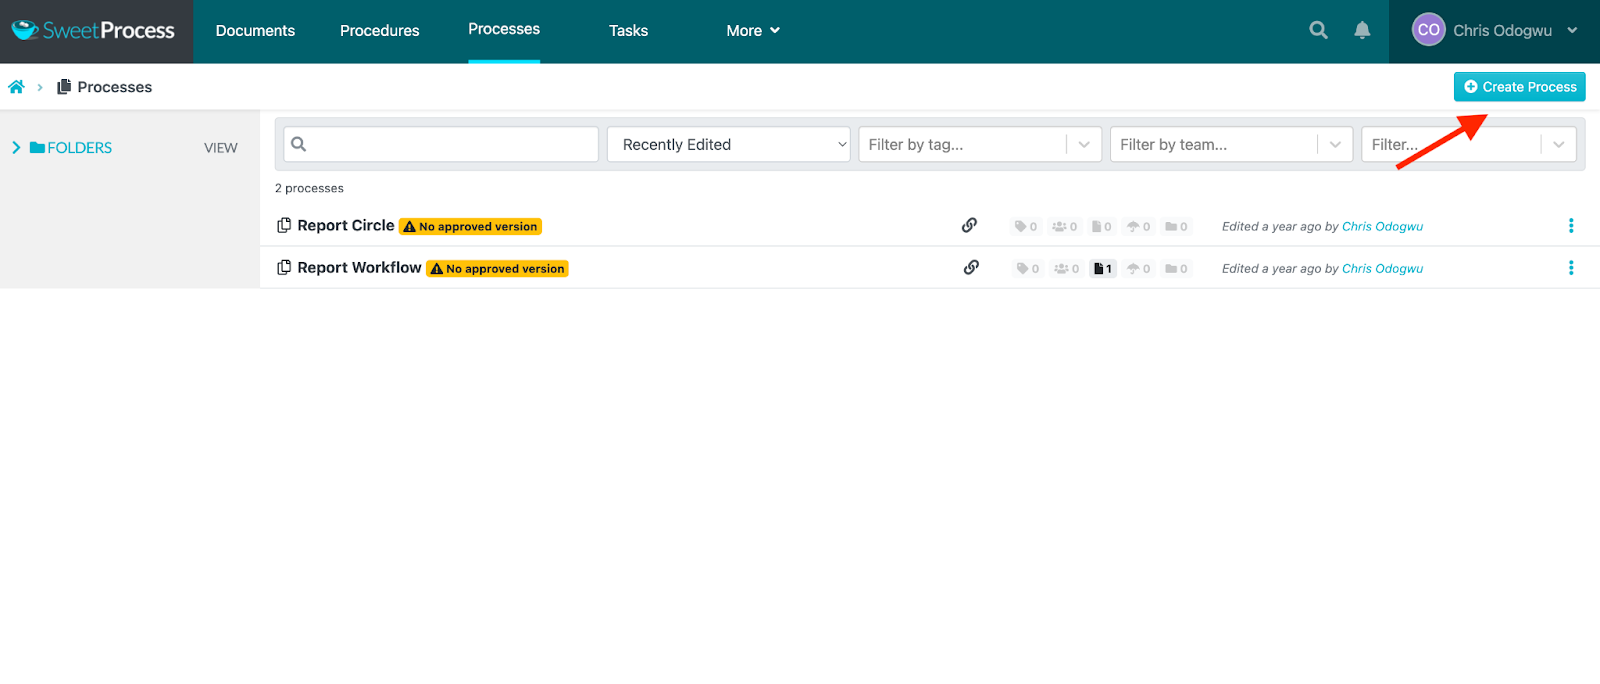
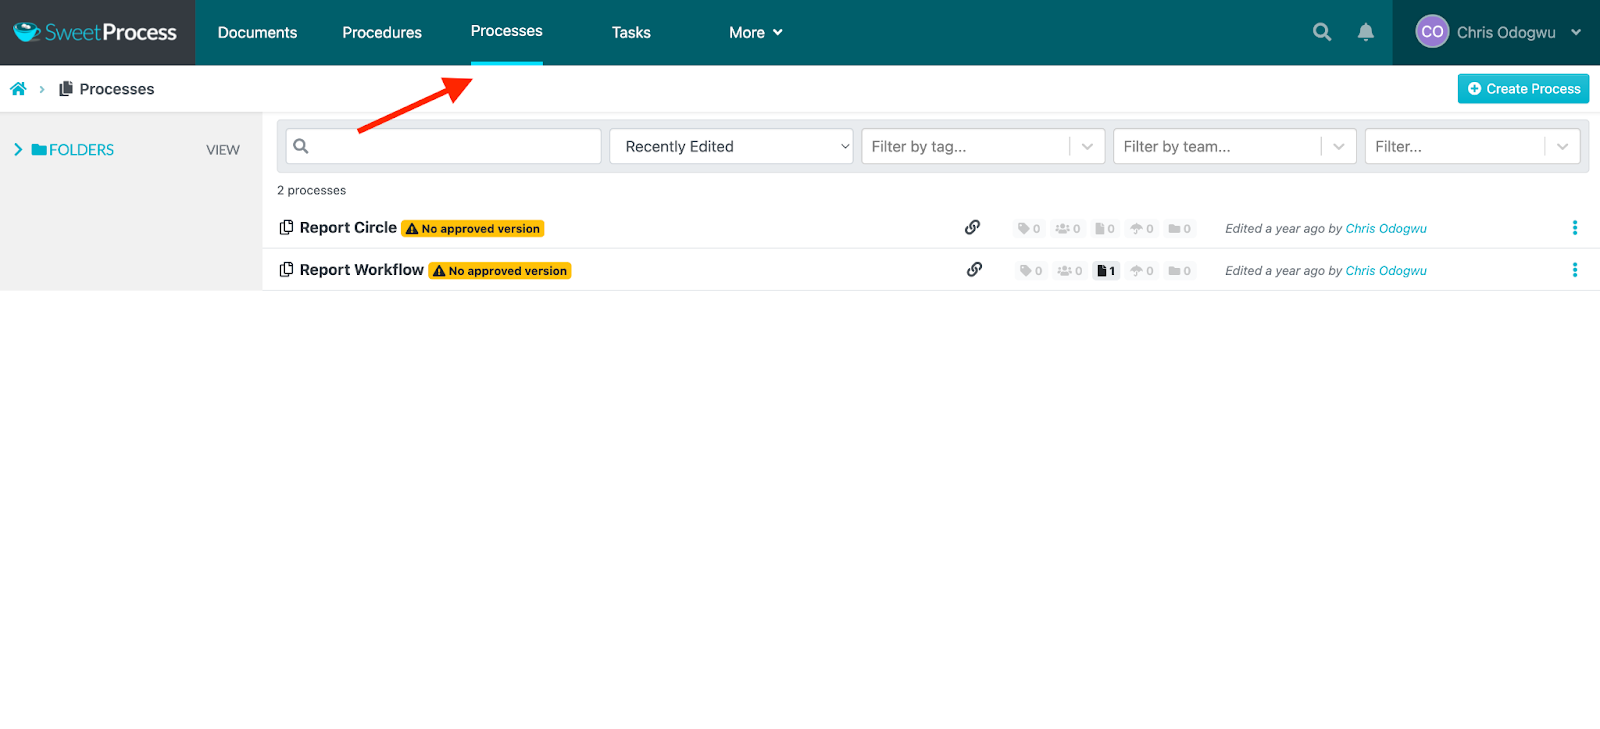
Click on “Processes” and then click on “Create Process.”
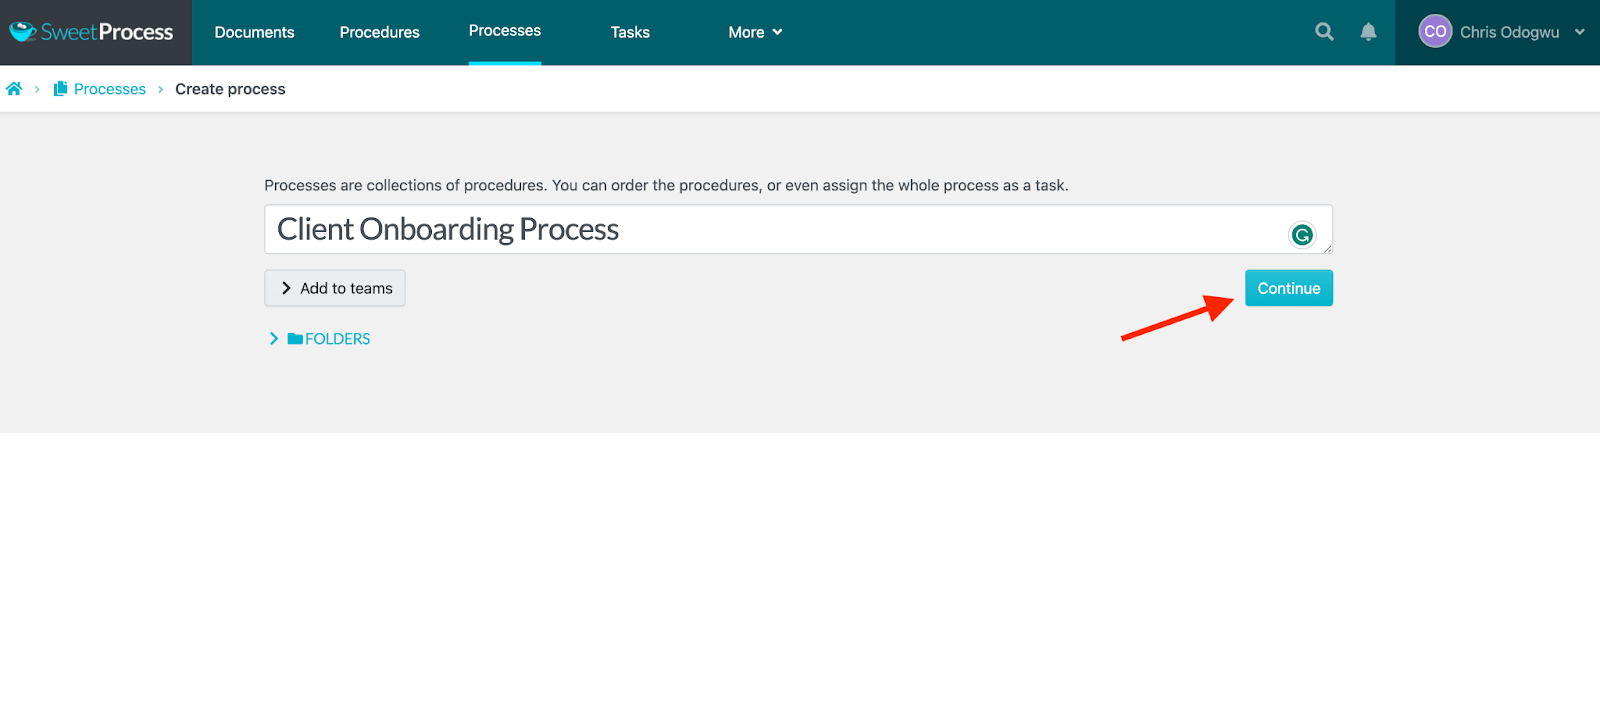
Enter the title of the process and click on “Continue.”
Click on “Add Step.”
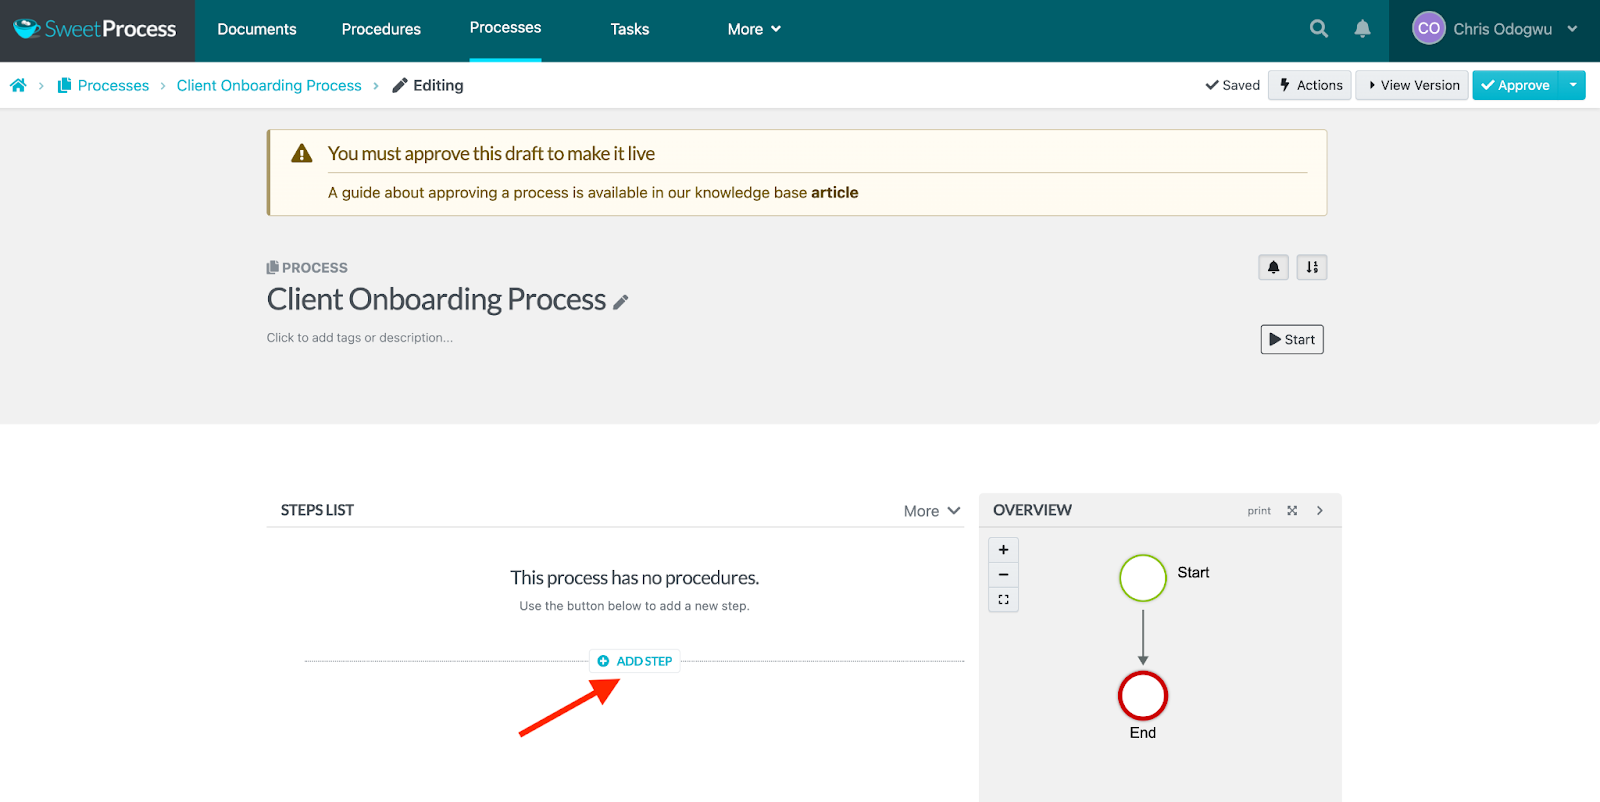
Click on “Procedure.”
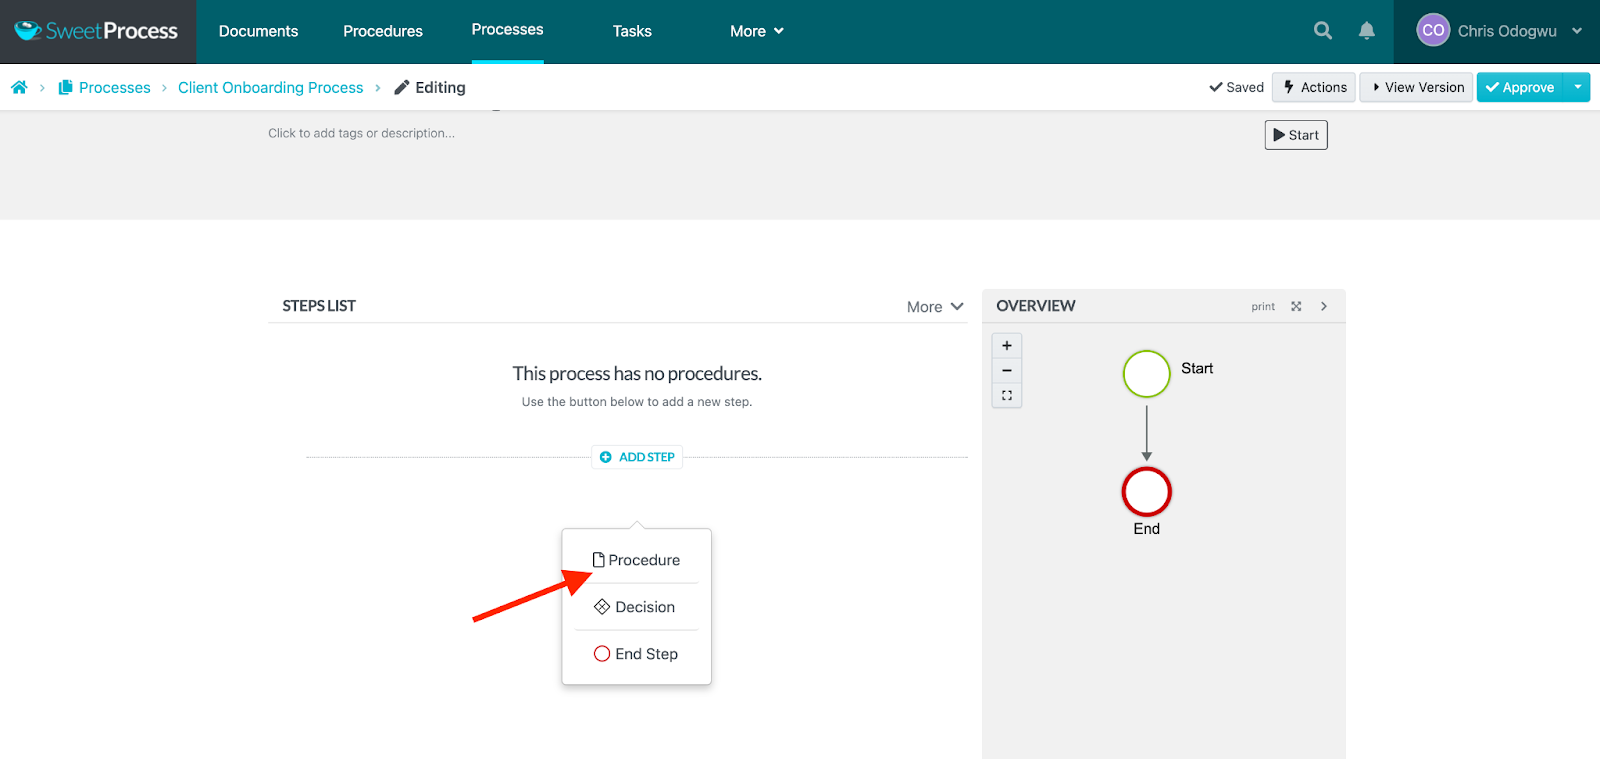
Select the first task or procedure from the menu.
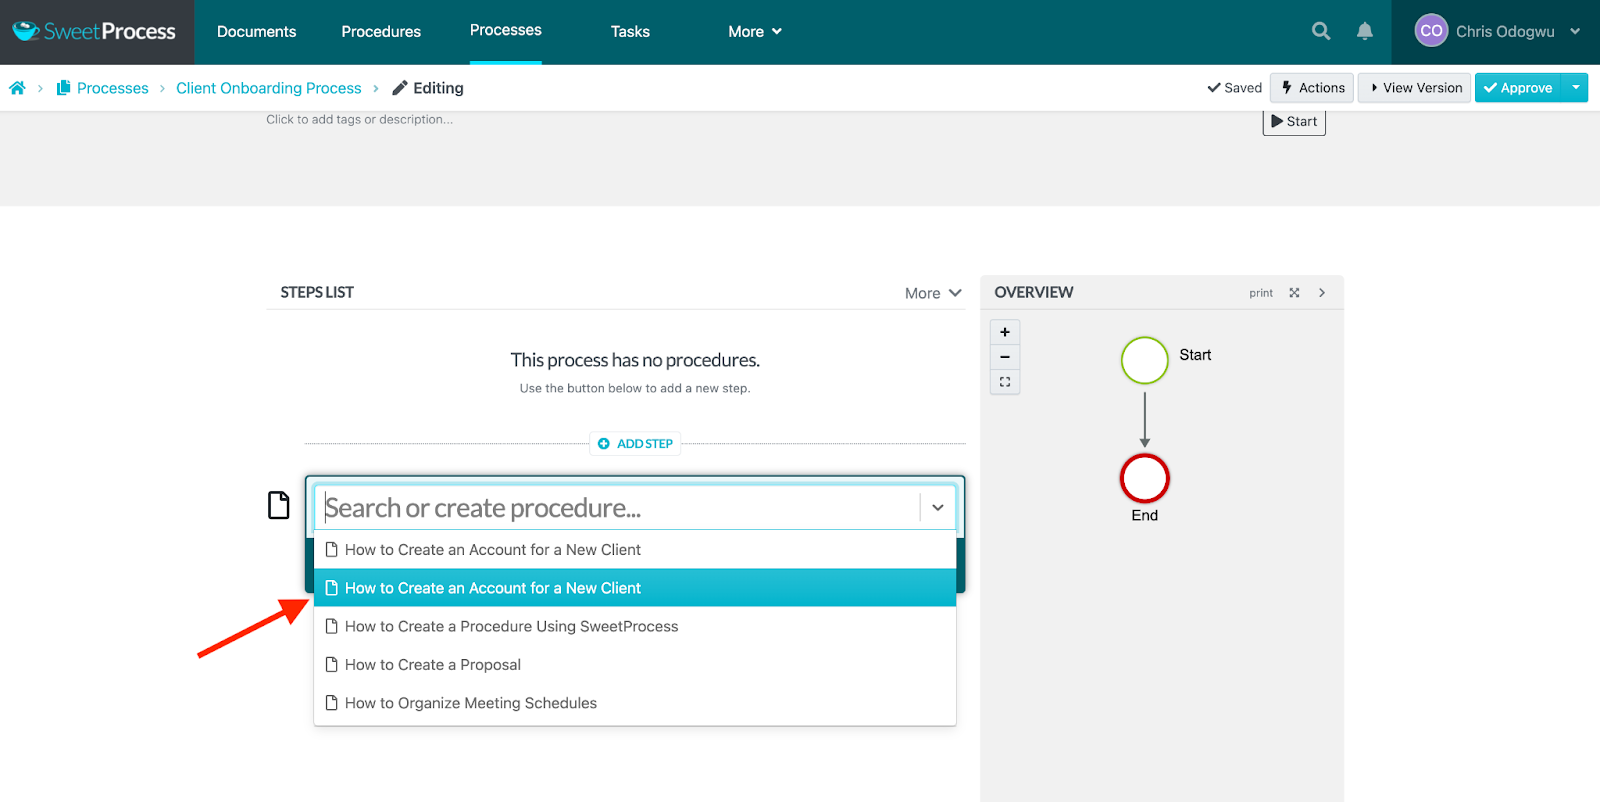
Click on “Add Step” and then “Procedure” to add the next step in the process.
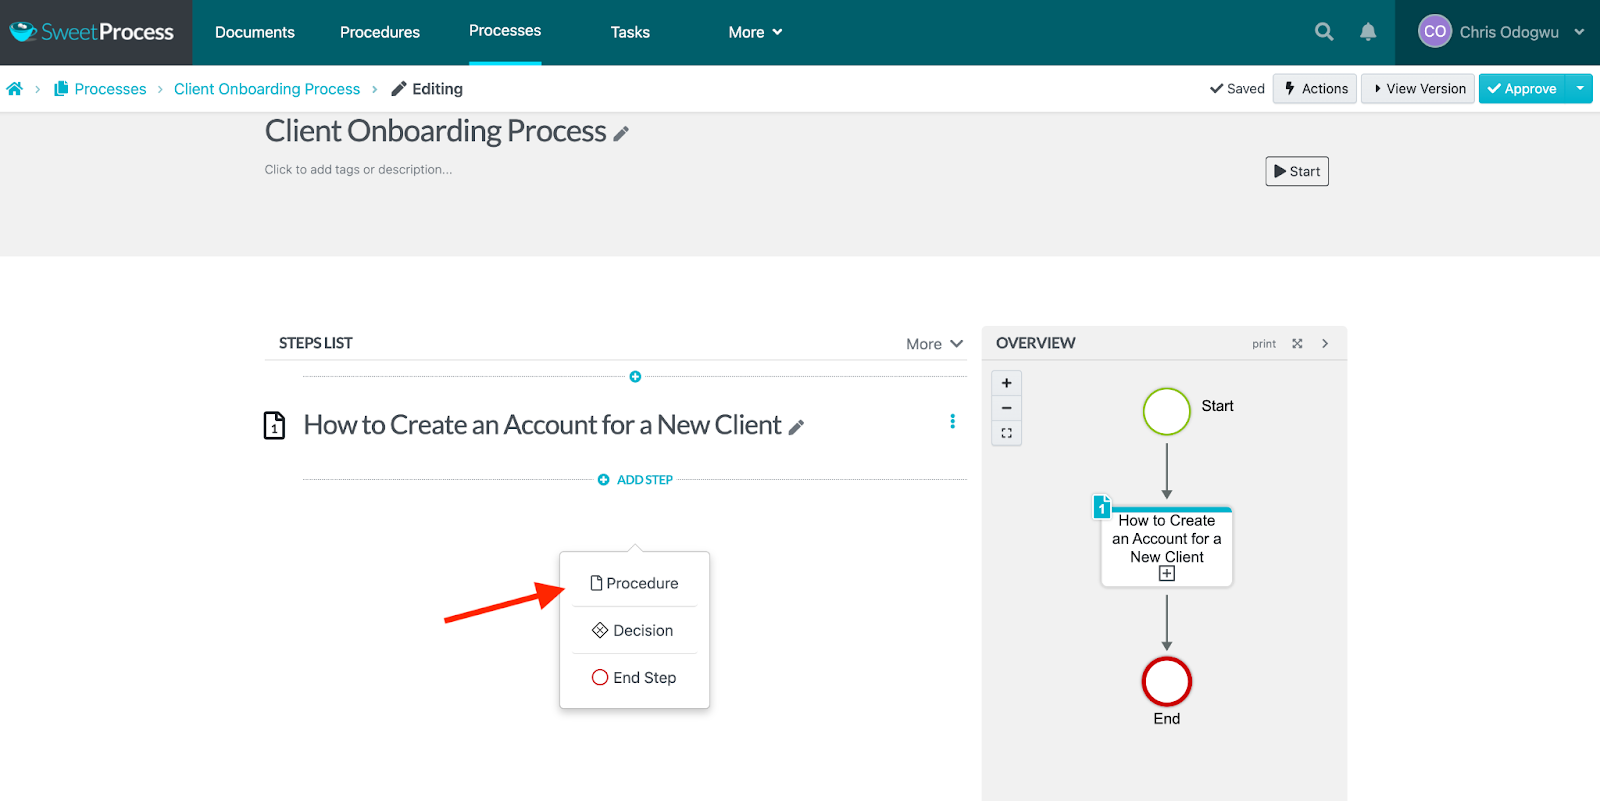
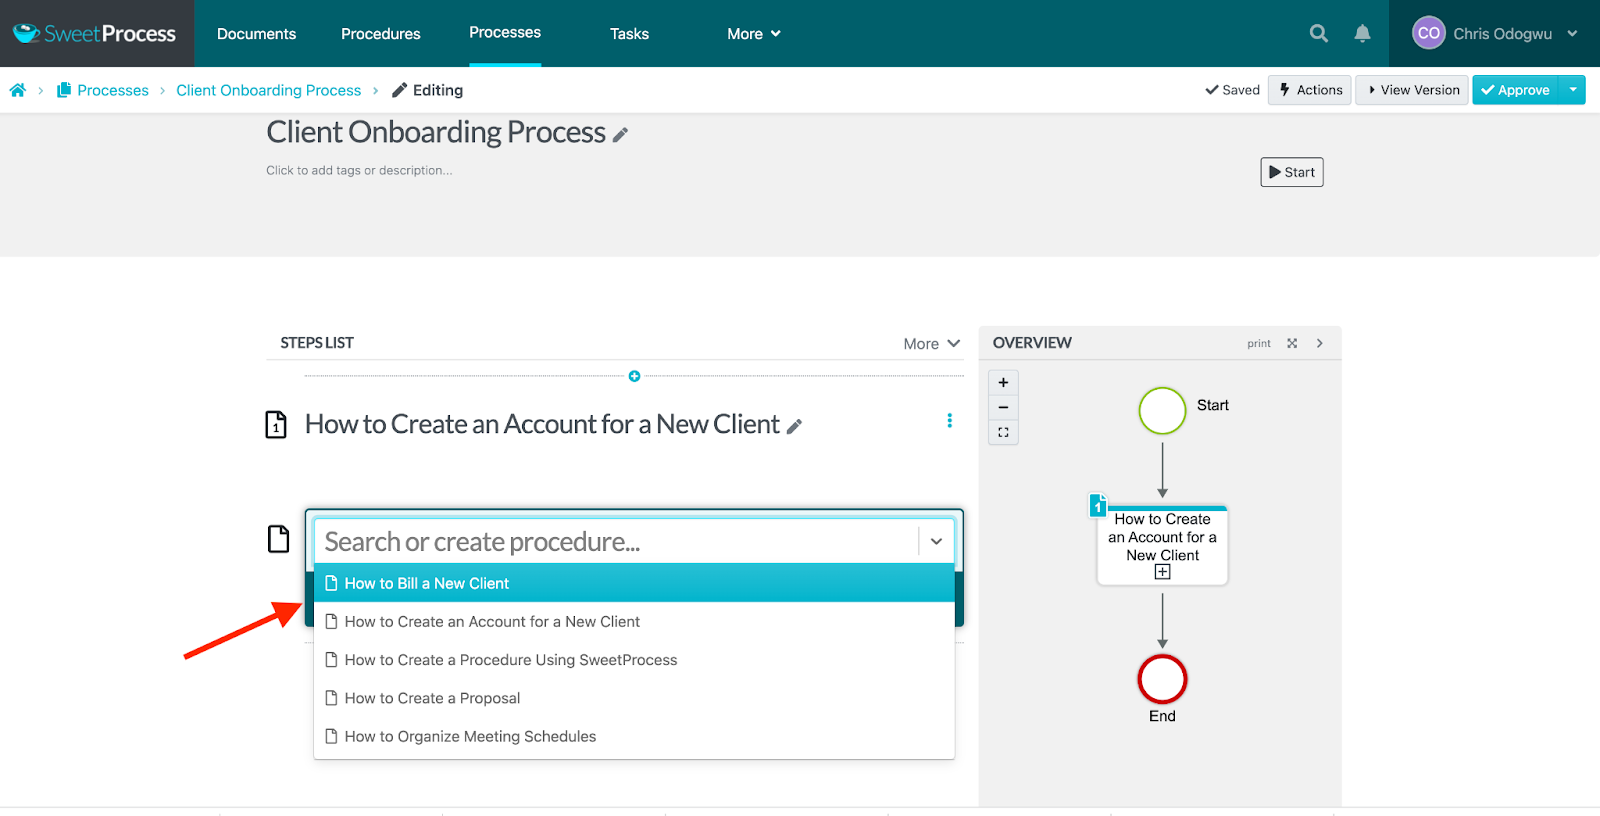
You’ll see all the steps you added to the process on the right. Click on “Approve” to publish it.
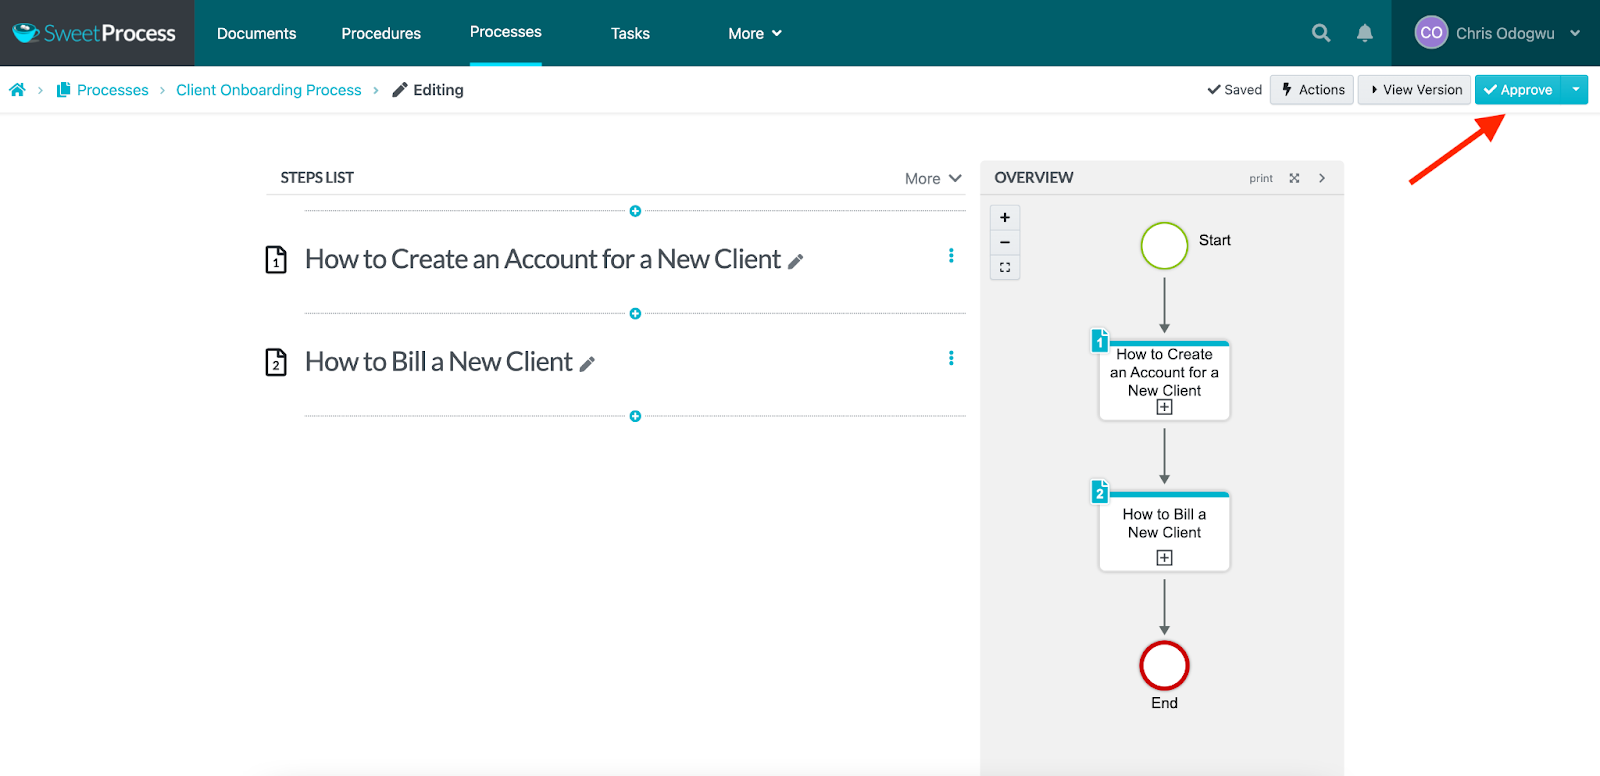
You may have noticed that the items added to the process are individual tasks or procedures. That’s because, technically, a process is a combination of procedures. SweetProcess allows you to create procedures with step-by-step instructions on how to execute independent microtasks. You can also generate a “process map” for these procedures. You have the option of creating a procedure manually or automatically with its content creation tool, SweetAI.
How to Document a Procedure in SweetProcess Manually
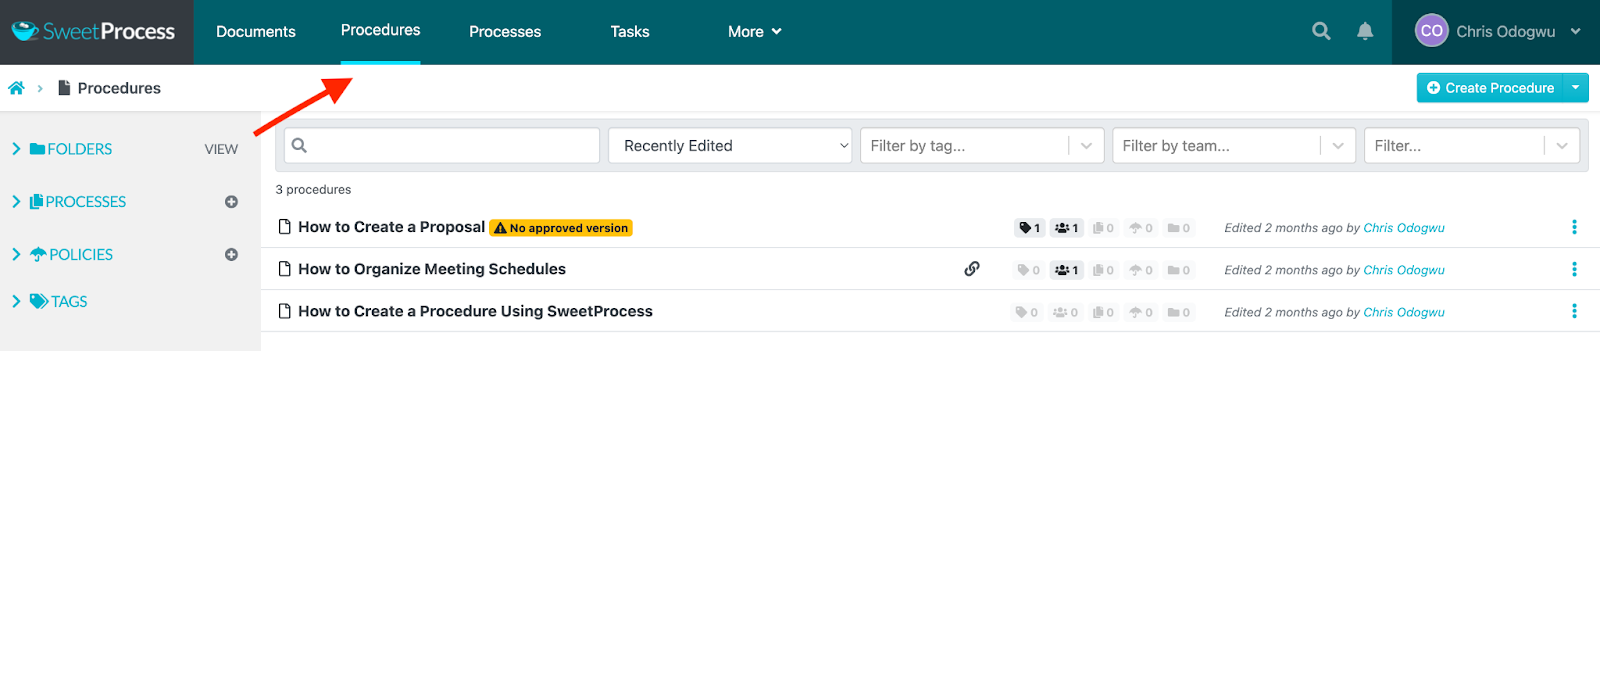
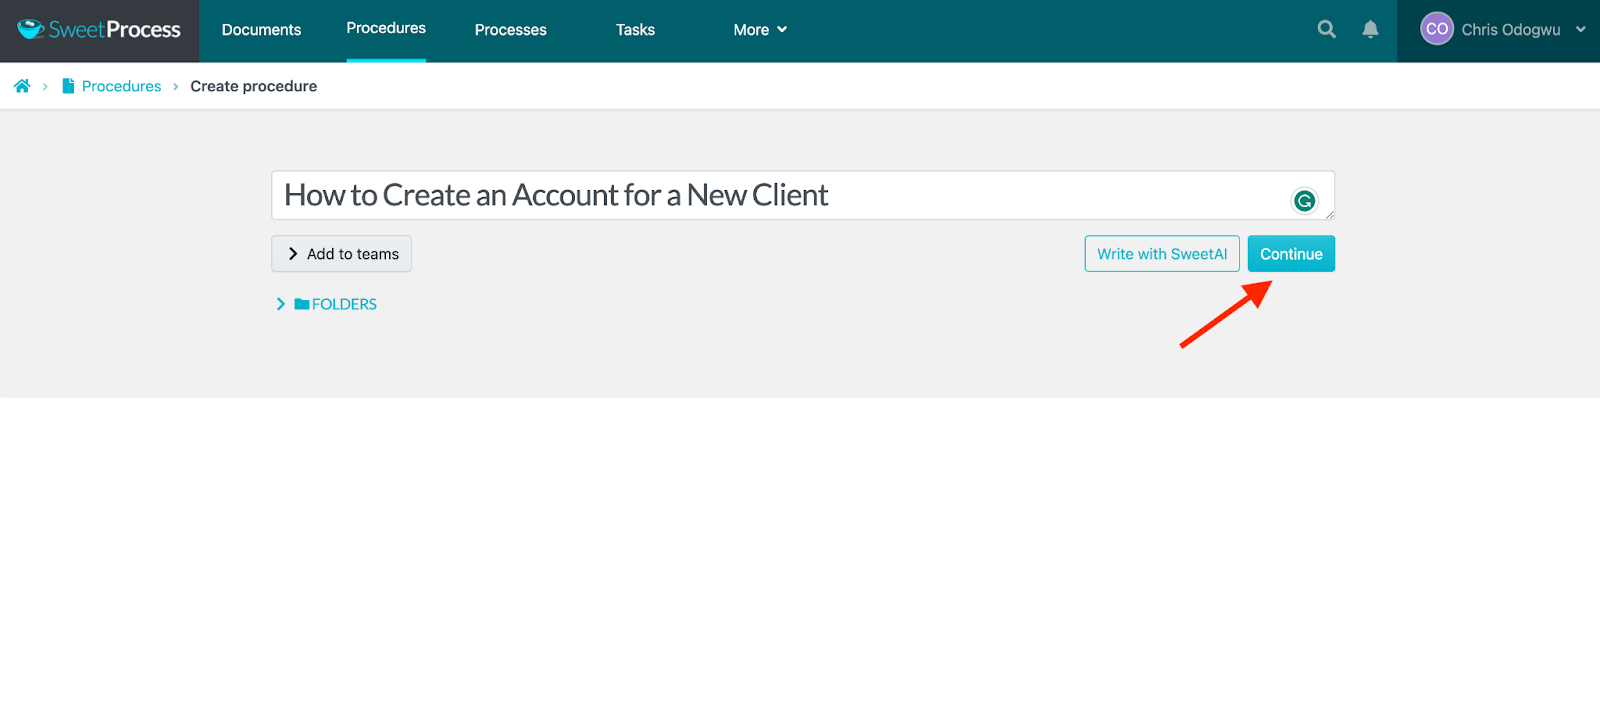
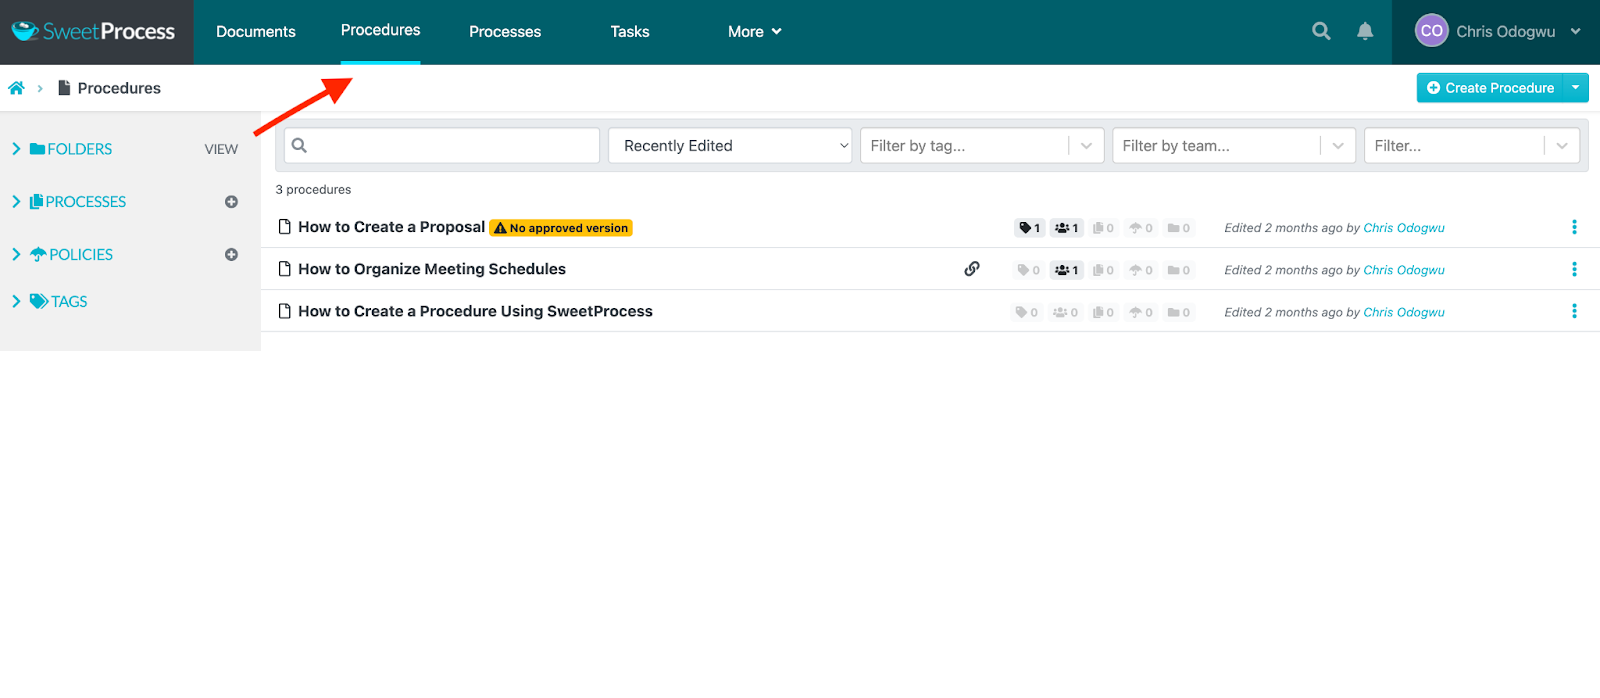
Click on “Procedures” and then click on “Create Procedure.”
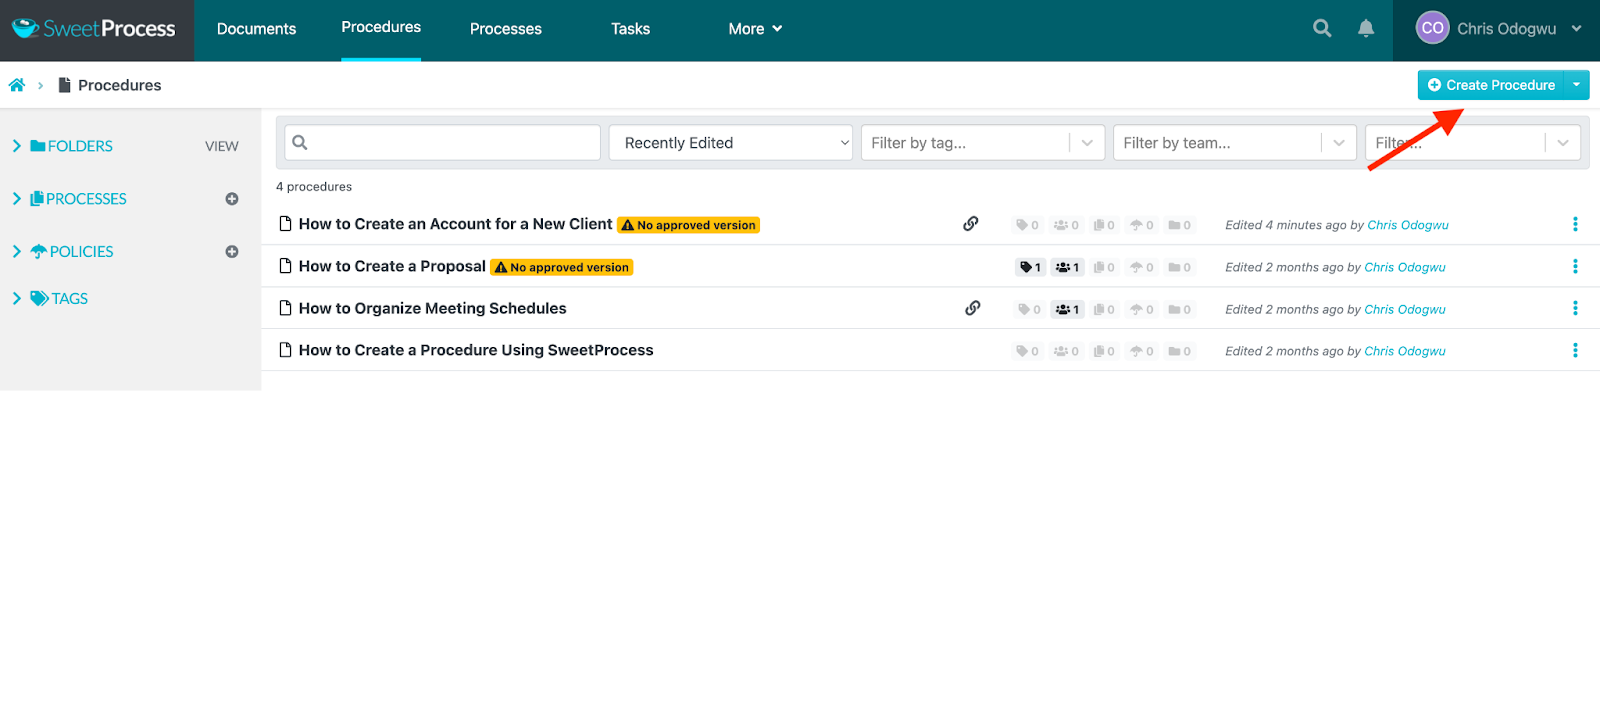
Enter your procedure title and click on “Continue.”
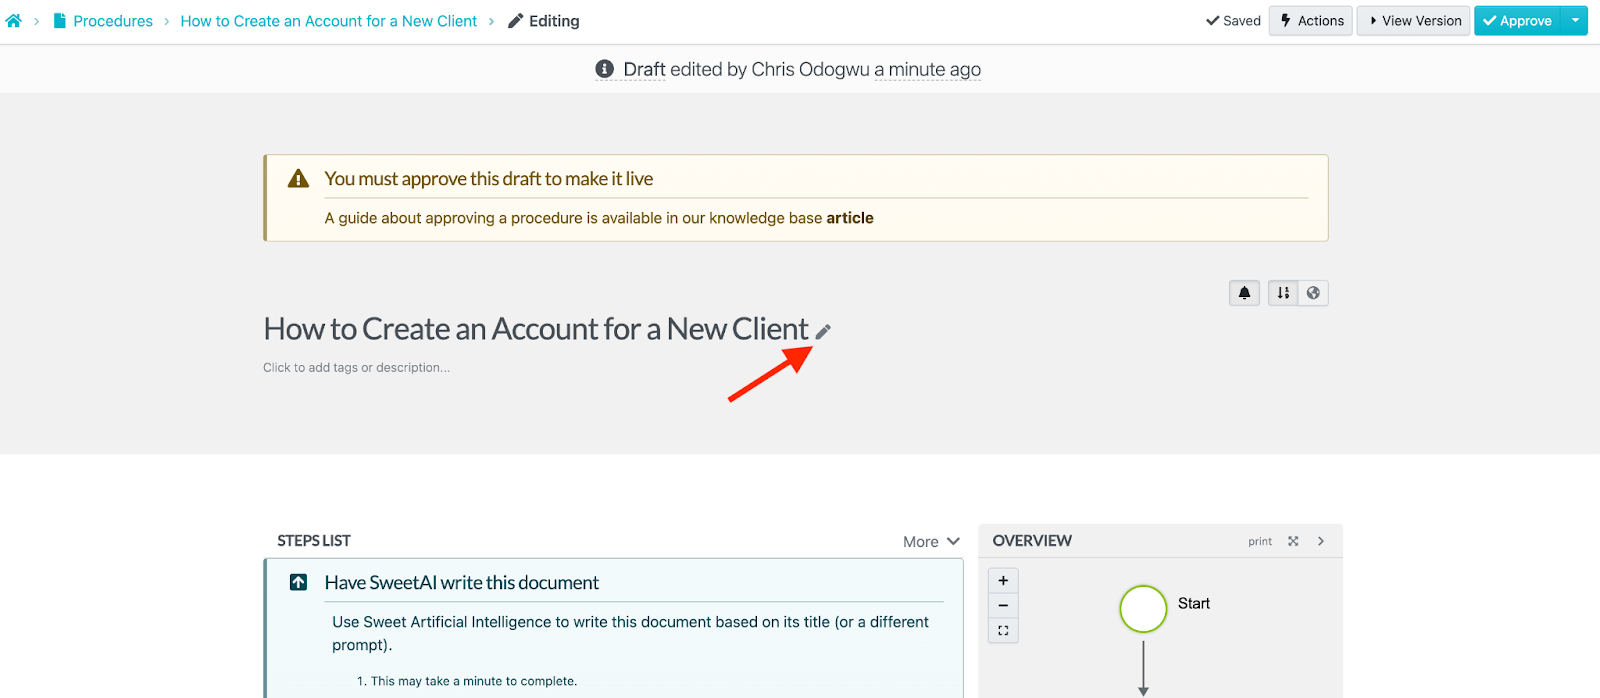
Click on the pencil icon beside the title.
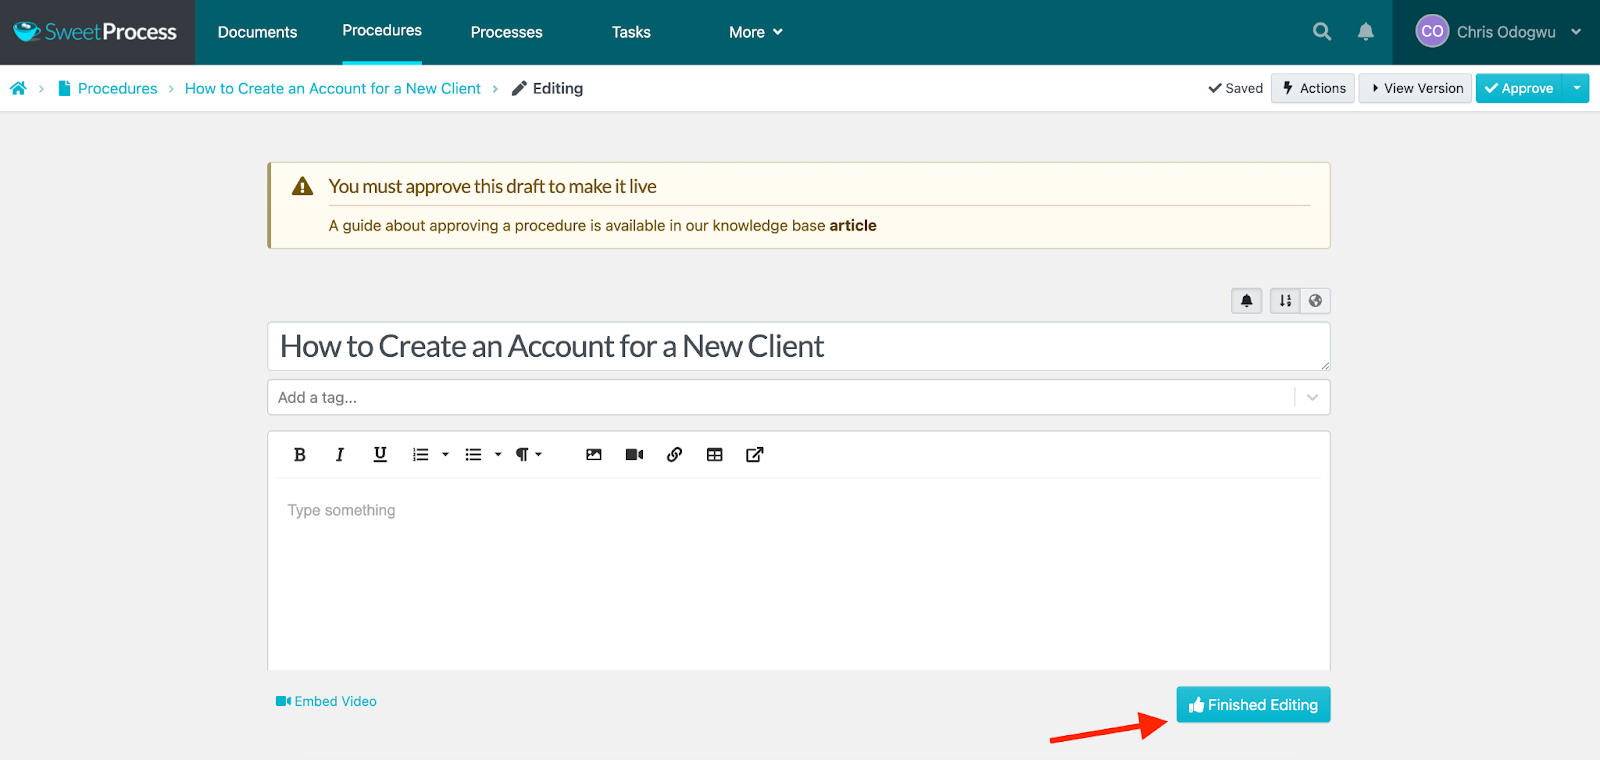
Enter the details of your procedure in the content editor and click on “Finish Editing.”
How to Document a Procedure in SweetProcess With SweetAI
Click on “Procedures” and then click on “Create Procedure.”
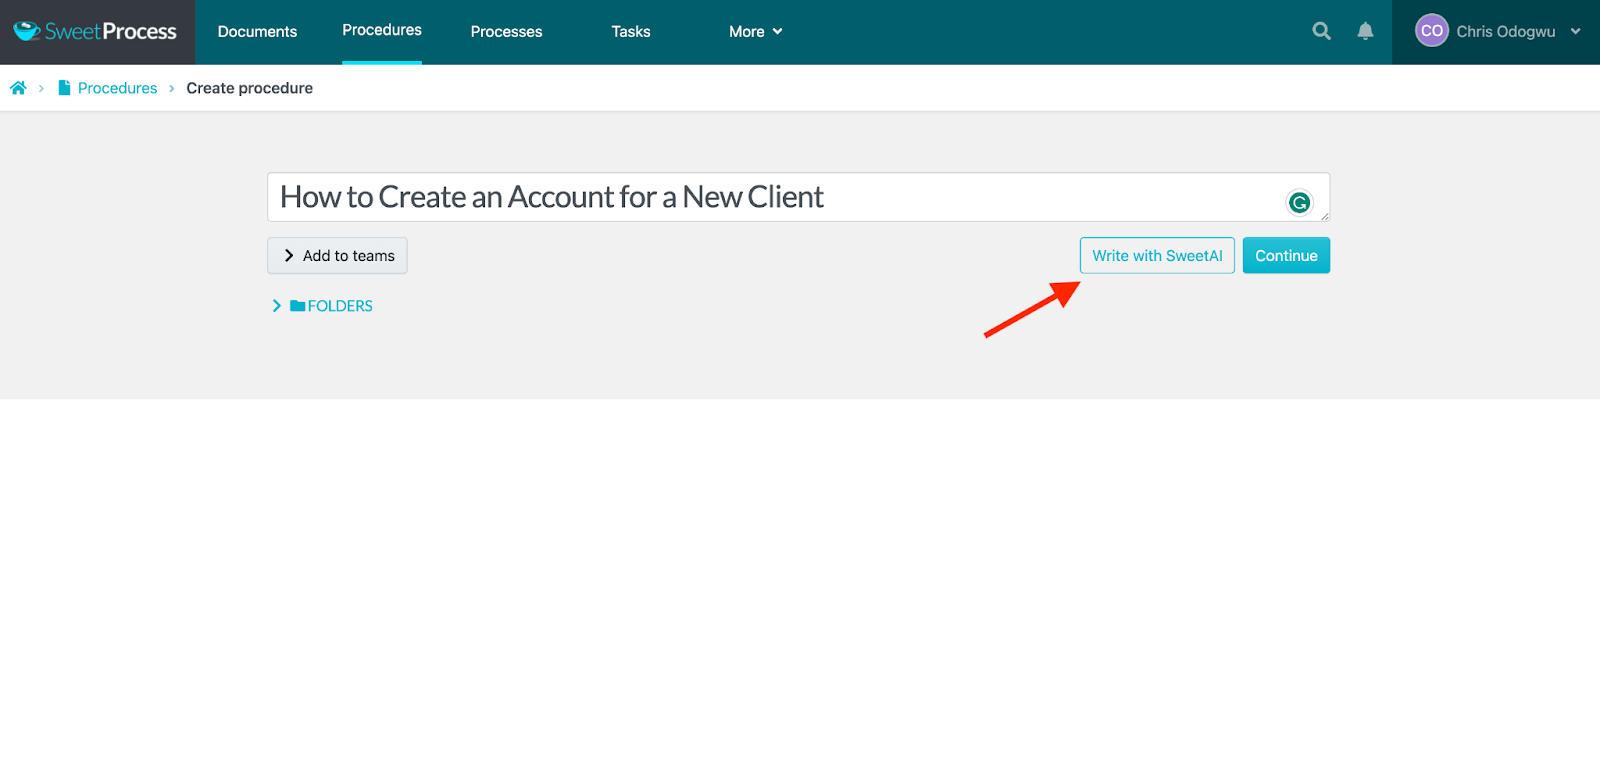
Enter the title of the procedure and click on “Write with SweetAI.”
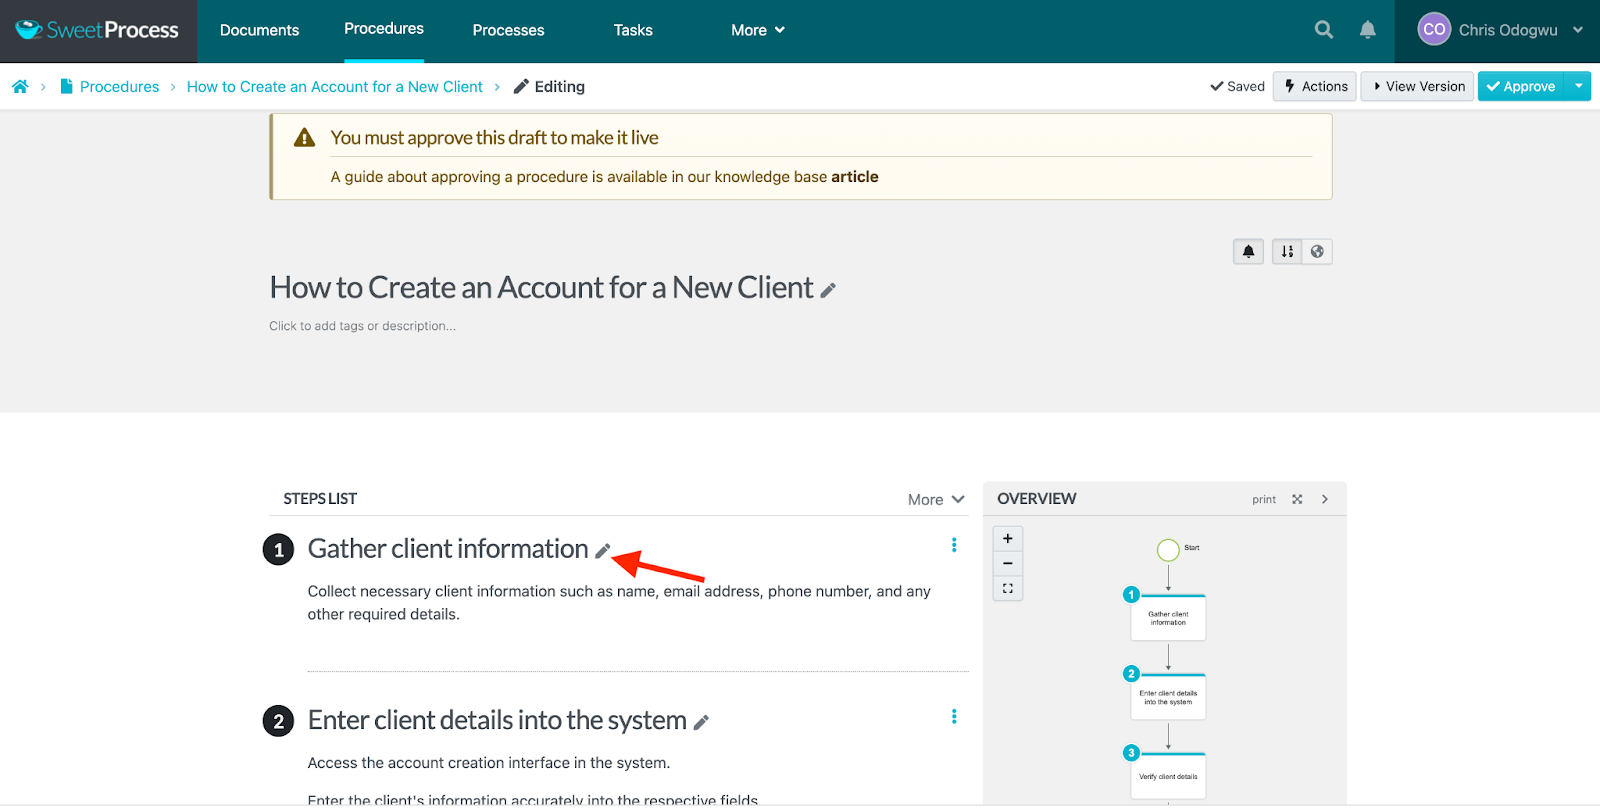
Wait for a few seconds while the system generates the content.
Click the pencil icon to edit the content if you wish.
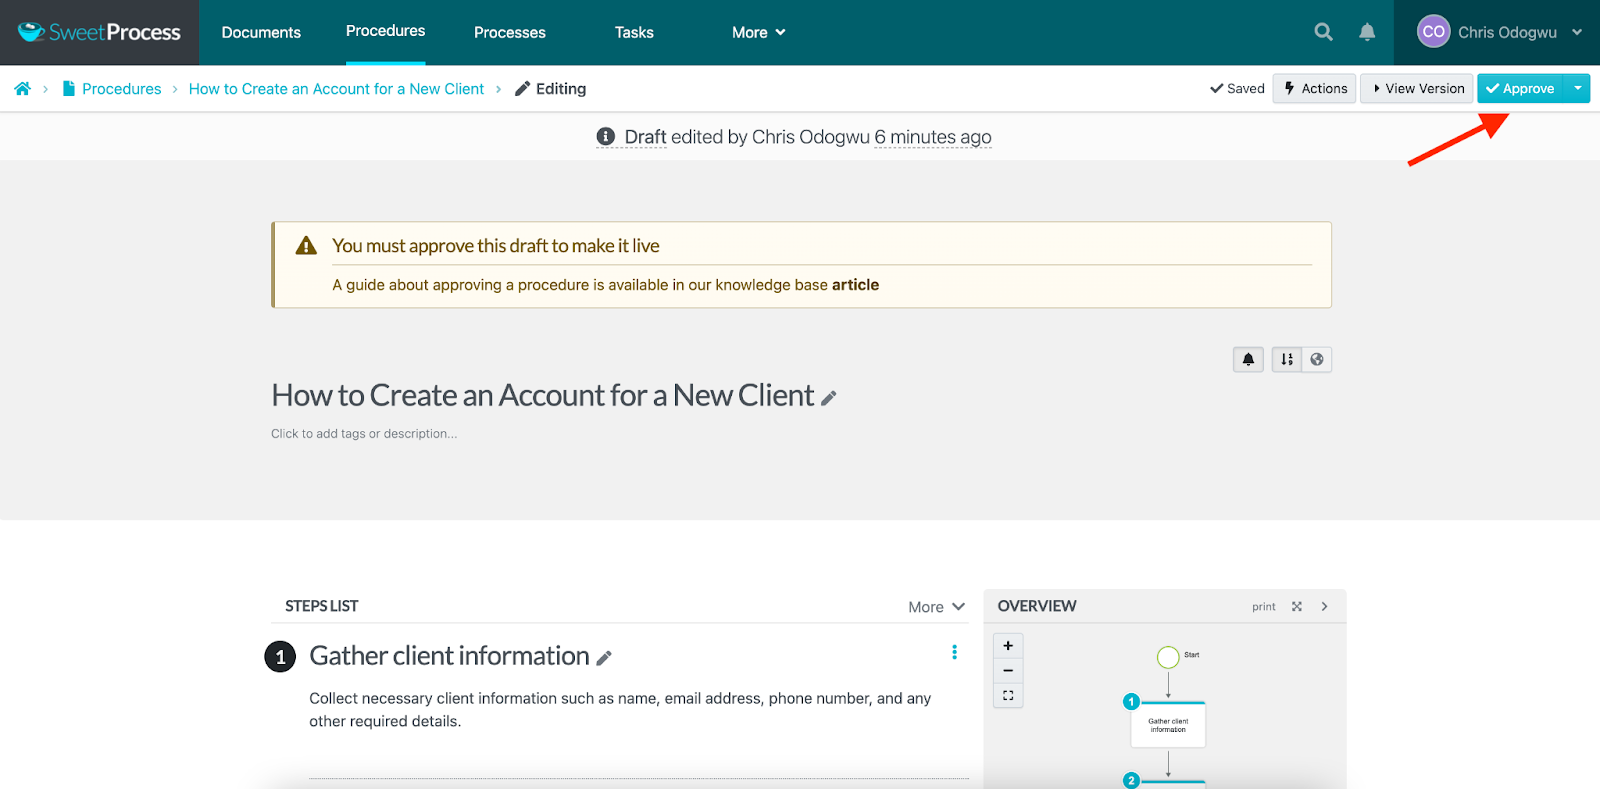
Click on “Approve” to publish the document.
How to Generate a Process Map From an Existing Process or Procedure in SweetProcess
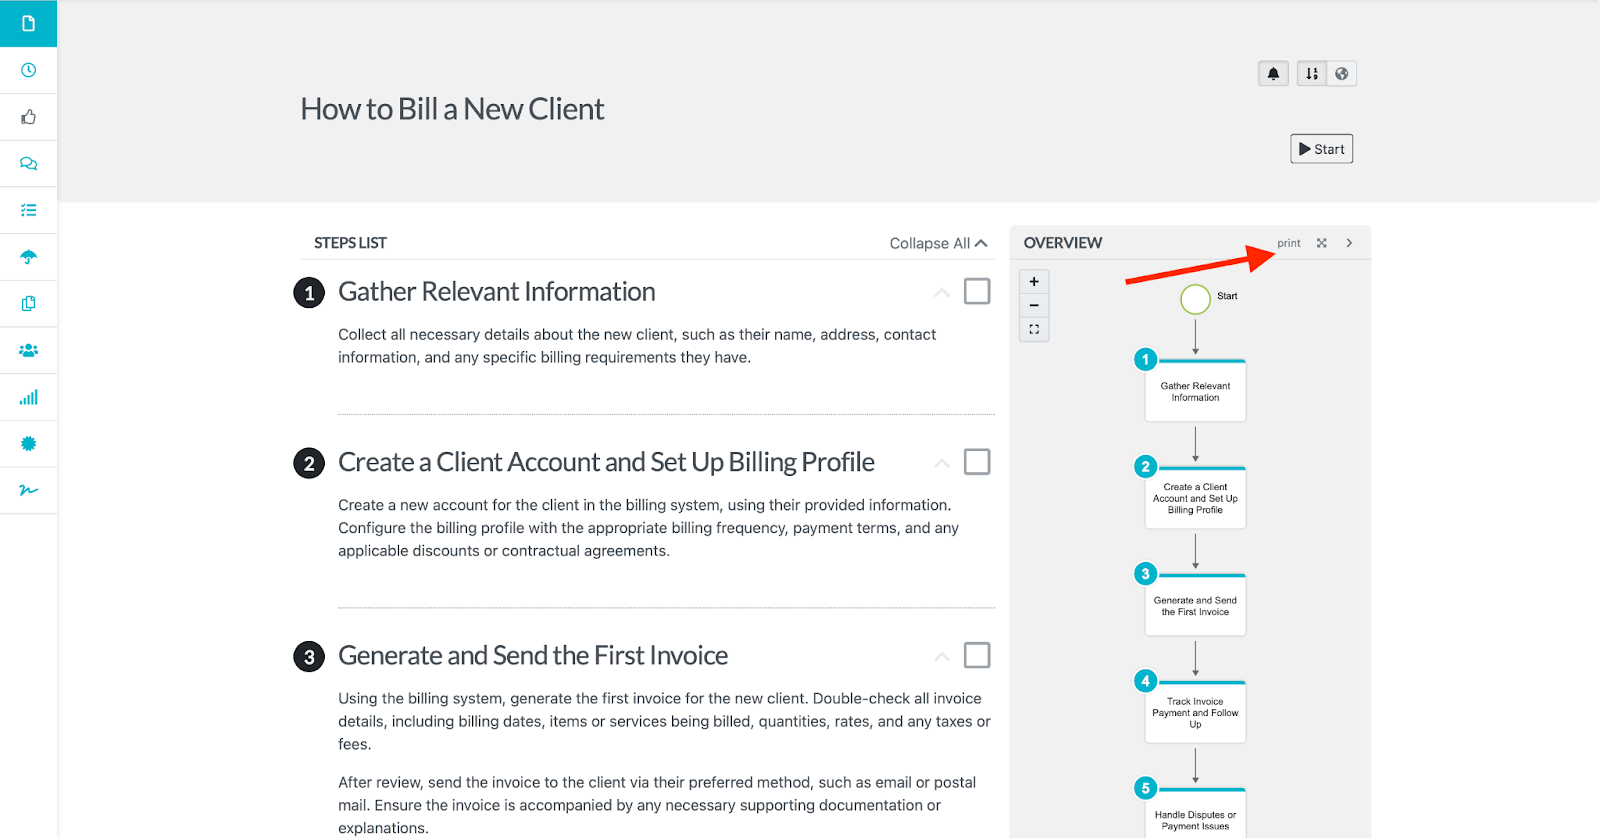
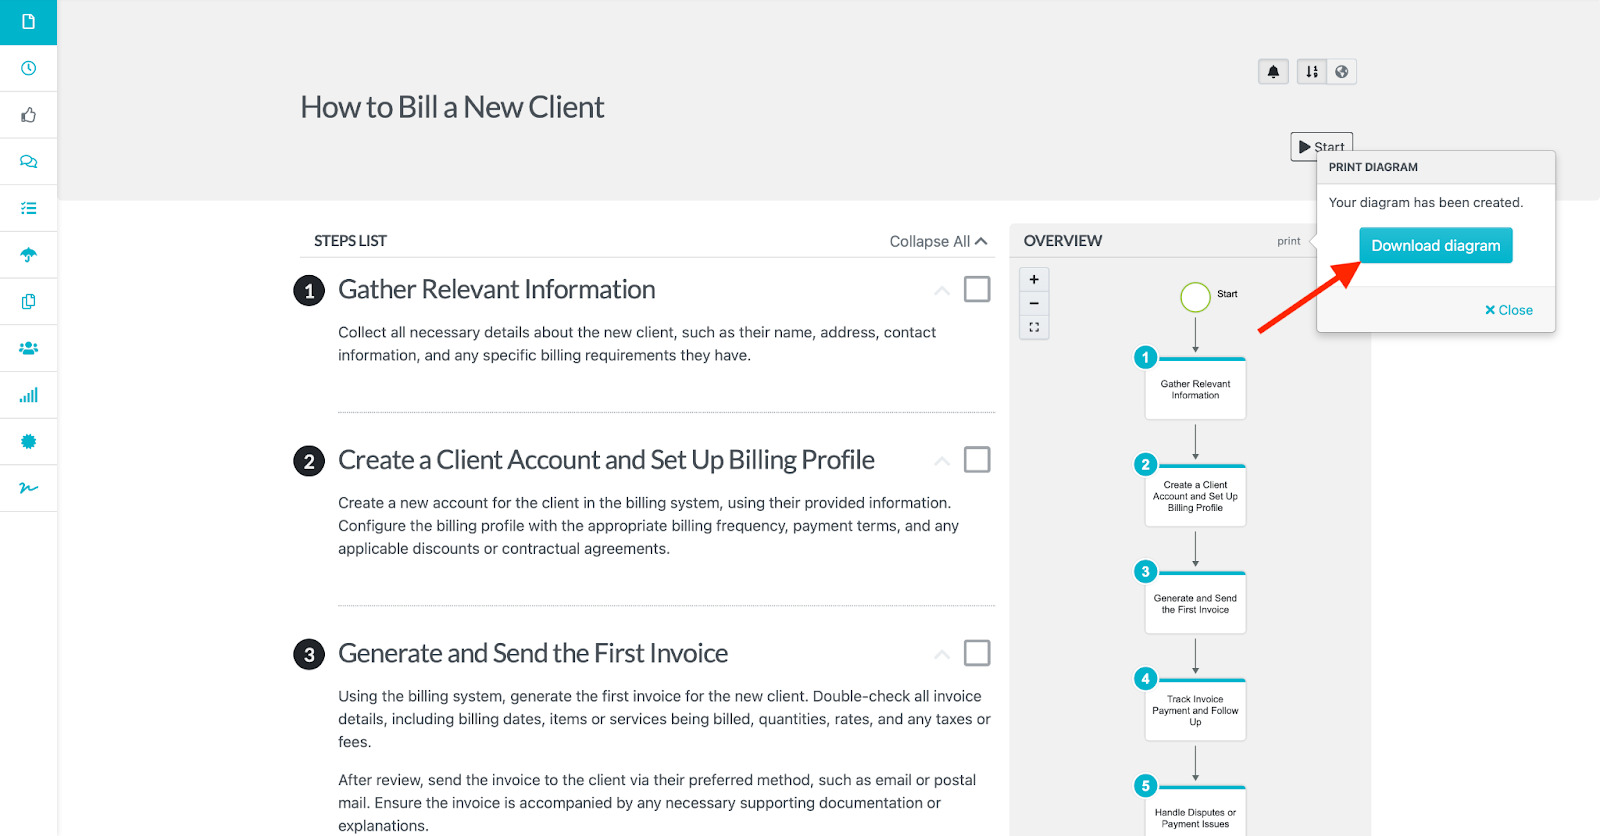
Generating process maps is automated in SweetProcess—the system creates a map for every process you create. This saves you time and resources, so you can focus on other activities.
Navigate to the process or procedure and click on “Print.”
Click on “Download diagram.”
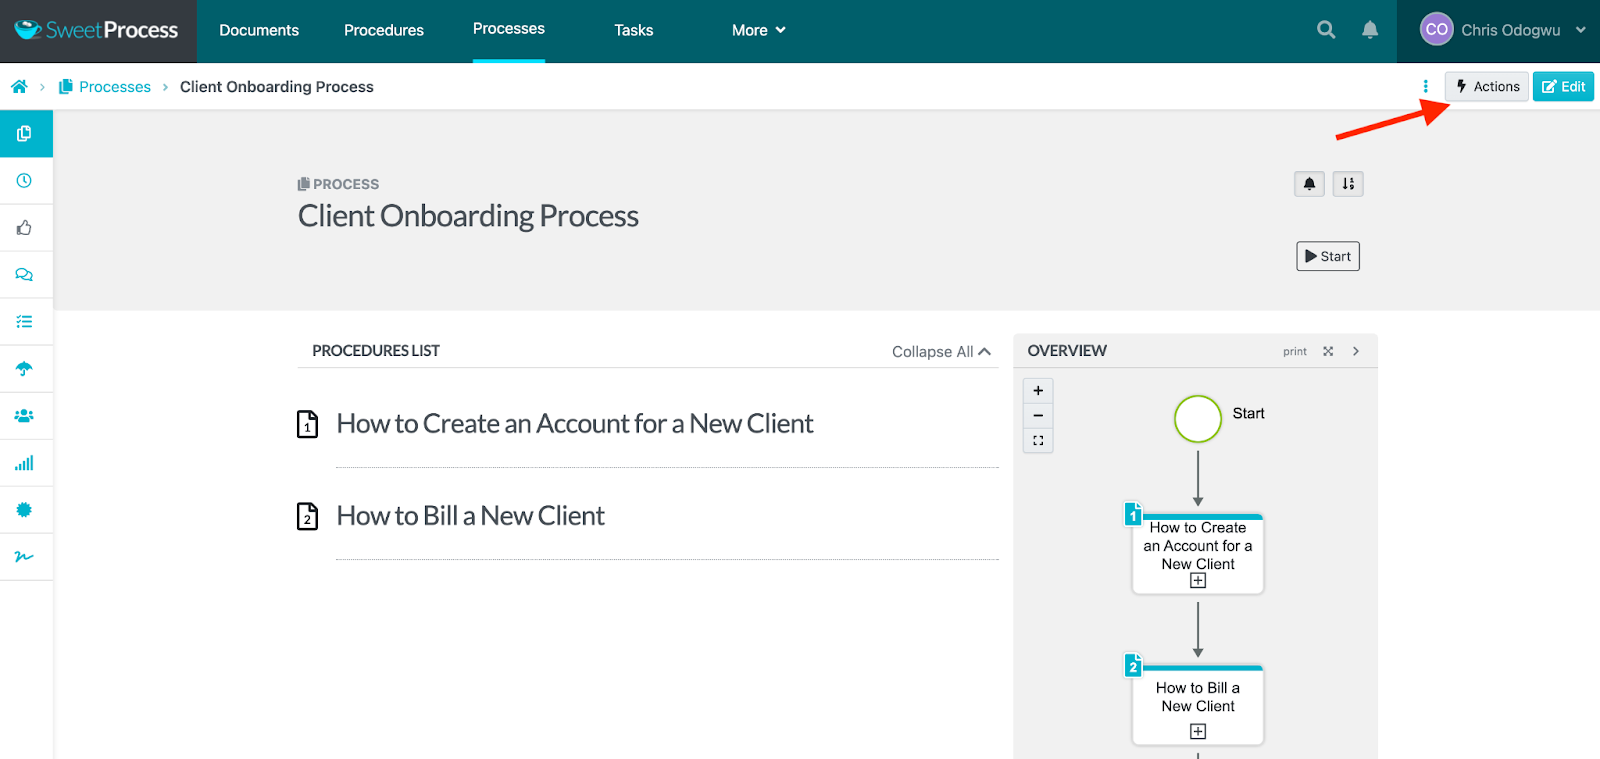
How to Manage a Process in SweetProcess
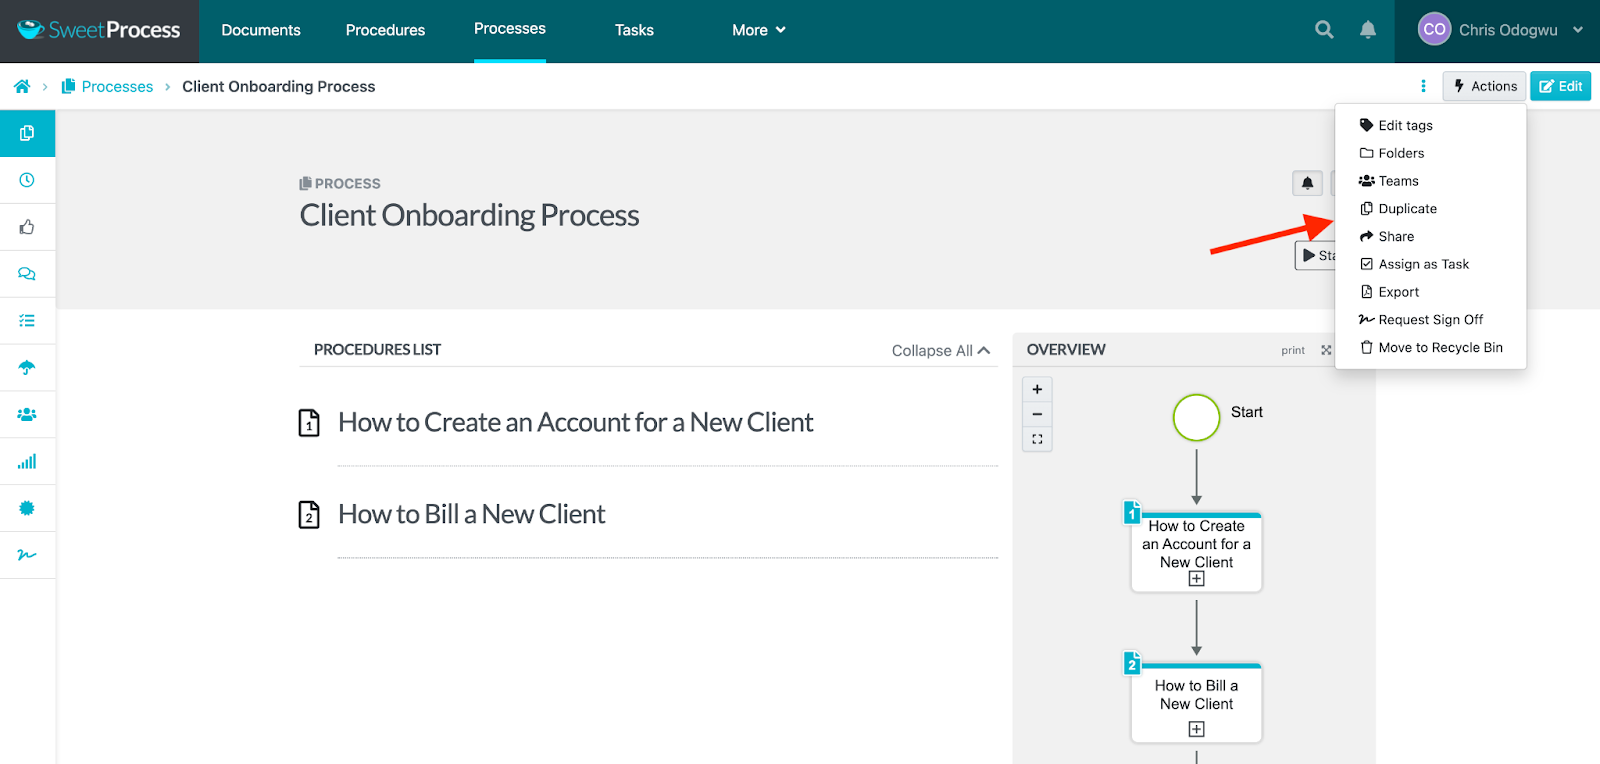
Navigate to the process and click on “Actions.”
Choose a task from the drop-down menu and follow the prompts.
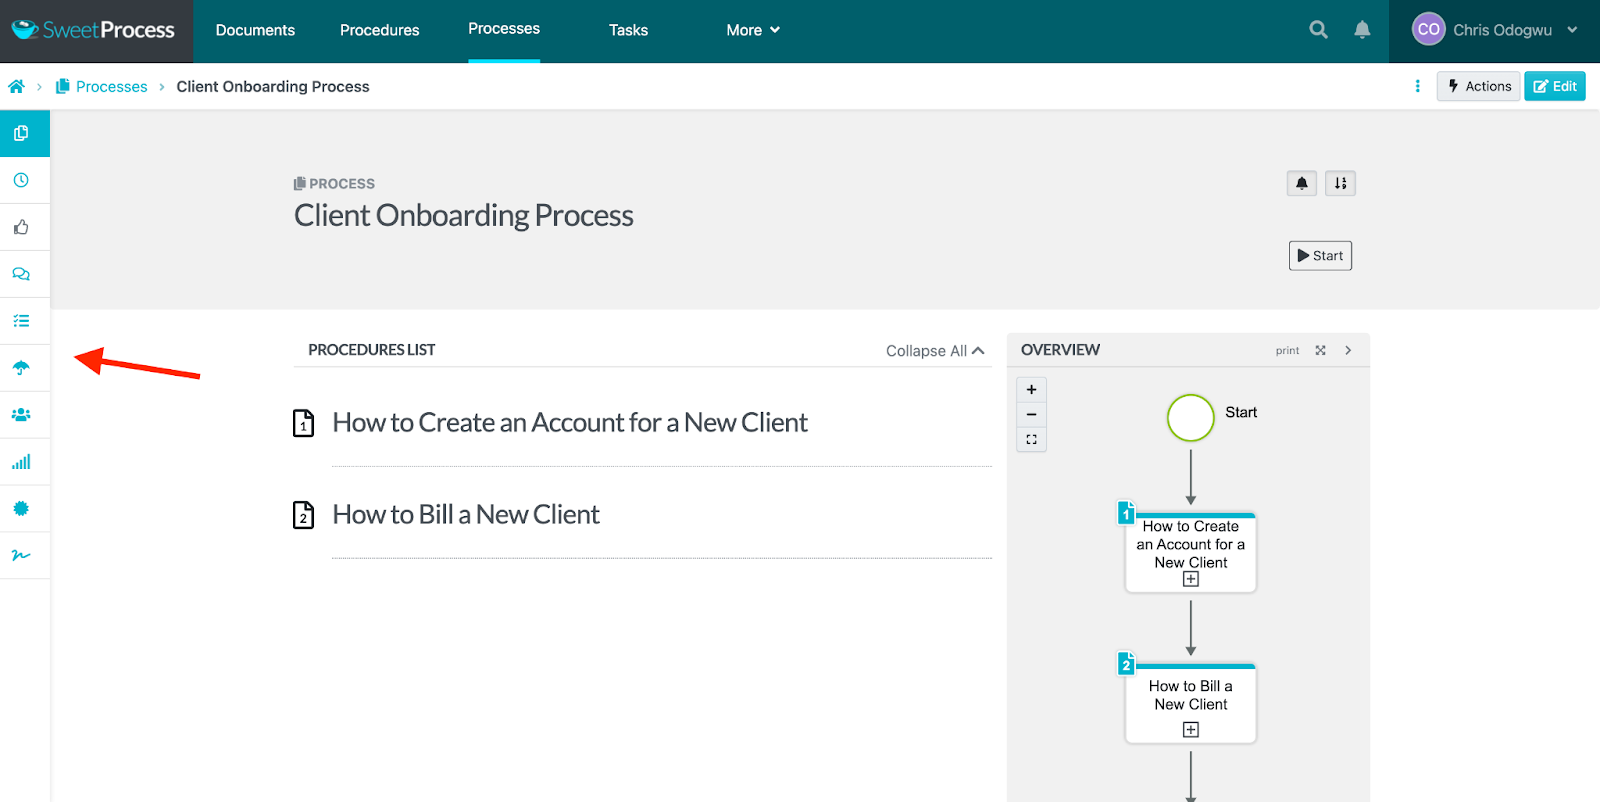
You can also manage tasks from the left-side menu. Hover your mouse on each symbol to view their command.
Several organizations have leveraged the above features in SweetProcess and more to enhance their operations. Jamie Ramsden, a business intelligence and lean Six Sigma champion at Turkstra Lumber, was amazed at how easily he could generate business process maps in SweetProcess. This has helped him and his team execute their tasks with more confidence and precision.
“The thing that caught my attention first was just something simple and visual, which is that SweetProcess automatically makes you a little flowchart as you enter your steps for any process. People understand things in different ways and a lot of our staff really like that if they can get a visual representation immediately,” Ramsden says as he talks about his experience using SweetProcess.
As we mentioned earlier, one of the benefits of having a process map is that it helps your customers understand your business better and increases their trust in you. CEO of ShipCalm, Ted Fogliani, is using this to his advantage with SweetProcess—he documents his processes and makes them available to his customers.
“I want the customers to see what we’re doing. I want to make sure nothing’s been lost in translation, and so we have taken those processes and we have put them into the knowledge base section of SweetProcess to where our customers have access to that,” says Fogliani.
SweetProcess is available to all businesses, not a select few. You too can accelerate your business operations and record tremendous success with it. Signing up for its 14-day free trial is a good start. No credit card is required for this, so you can simply walk away if you don’t find it useful.
Types of Business Process Maps

There are various business process maps, each suitable for particular needs.
Top-Down Process Flowchart
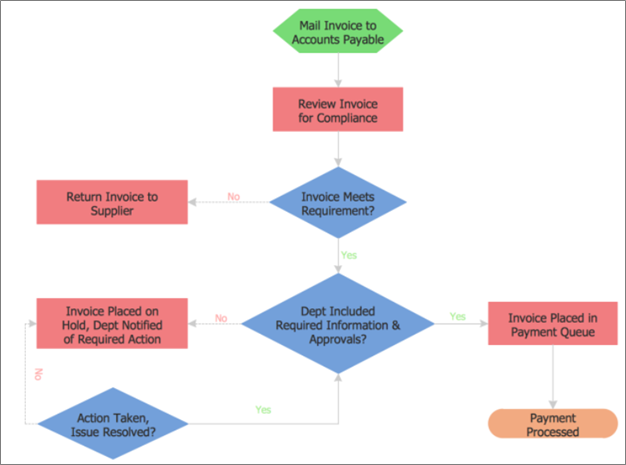
The top-down process flowchart is also known as a high-level flowchart. It emphasizes the main tasks in a process with little details of their subtasks. The major steps are drawn horizontally at the top and their subtasks are underneath in numbers. It’s effective for sharing business ideas with external parties so they get a glimpse of the task without going into much detail.
Cross-Functional Flowchart
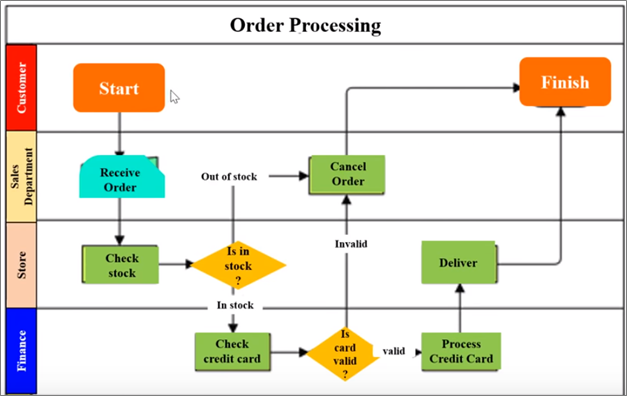
A cross-functional flowchart is also known as a deployment flowchart and swimlane diagram. It illustrates the steps in a process and the parties who perform them. This style of process mapping is most useful for delegating duties and promoting accountability among team members.
Process Flowchart
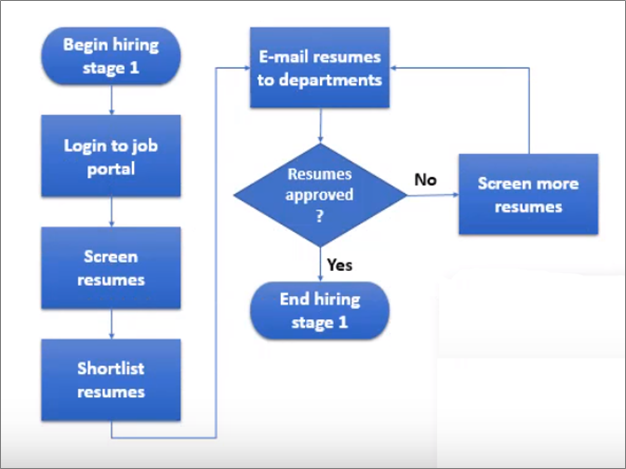
A process flowchart captures the steps in a task and the decisions executors of those steps must make to advance the workflow. It represents each step with a shape and connects it to the others with arrows in the right direction. They are easy to understand because the steps are illustrated sequentially. Creating this flowchart is easy—you can use either freehand or a drawing tool.
Detailed Process Map
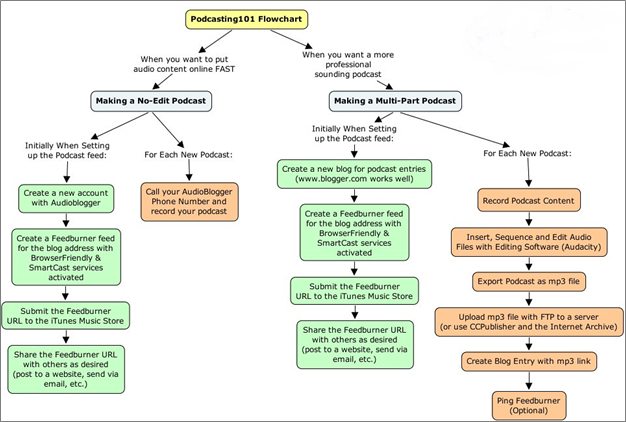
A detailed process map illustrates the steps in a process, the people who perform them, their input, and anticipated output. It contains all the details of the work circle that anyone performing the task for the time may need. It’s good for visualizing long and complex processes that would require long texts in writing.
Value Stream Map
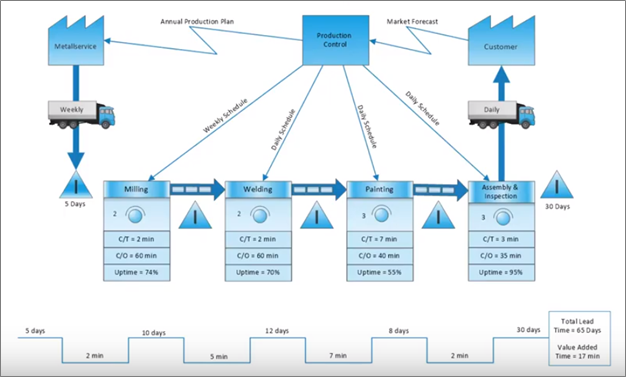
A value stream map is a visual presentation of the critical steps in a process, quantifying the resources and time deployed at each process step. The motivation behind this kind of process mapping is eliminating redundancy to prevent waste. Every item in the value stream map plays a significant role in increasing efficiency.
SIPOC Diagram
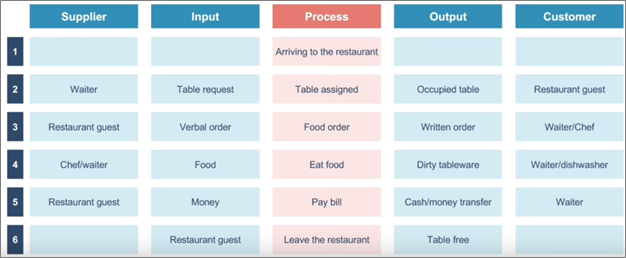
A suppliers, inputs, processes, outputs, and customers (SIPOC) diagram showcases the relationship between stakeholders in a process. It highlights the suppliers—their inputs and outputs to the receivers, who are often customers. It’s mostly deployed in tasks targeted at enhancing customer service and experience.
Data Flow Diagram
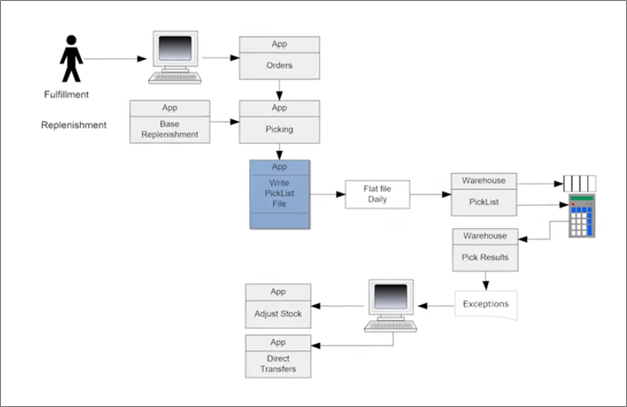
A data flow diagram showcases how information flows in a process. It involves the use of established symbols like arrows and rectangles to represent inputs, outputs, and other components of the process chart. Visualizing the information flow enables you to discover bottlenecks and improve overall performance.
Best Practices and Tips for Business Process Mapping

Whatever kind of business process map you decide to create and adopt, there are established principles to guide you in getting the most out of it.
Reduce Complexity
Even the most basic tasks may seem difficult to someone performing them for the first time. A process map isn’t a work of art with design elements for aesthetics. Every piece of information or symbol on it should visualize the task. Avoid any items that might confuse the viewer.
Establish the Main Goal
Be clear about the results you anticipate from mapping the complex process. Your goal is more attainable when you outline your objectives and examine the practicalities. Develop metrics for measuring the success of your process map in the end.
Use Visual Symbols
Symbols direct users at a glance and explain the required actions. Incorporate different symbols for various instructions. They make your process map more actionable and save space you would ordinarily use to explain terms in texts.
Use the Right Resource
Business process mapping is a specialized activity. The quality of your map boils down to your technical skills and the tools you adopt. There are software applications you can use to create your process map without necessarily having high-level technical skills, but if you can’t use such tools, engage experts to guide you.
Identify Dependencies
Some activities in a task may be intertwined. Showcase this dependency on your map by highlighting the connected activities. This information notifies the task performers of the impact and progression of their inputs.
Seek Opportunities for Improvement
Don’t get complacent with your process map if you are keen on maximizing your processes. Always strive for process improvement even when it looks good on the surface. Pay close attention to your performance to identify bottlenecks. Constantly engage team members to get feedback and recommendations.
Implementing these strategies is one-half of the task in effective process mapping. The other half is adopting the right process mapping software—one with an excellent track record. SweetProcess has been instrumental in the growth of Forensic Analytical Consulting Services (FACS), an environmental health consulting firm; it’s the default go-to system for directions. This has made life easier for the Director of Operations, Kevin Trapp.
“The best testament I can give is that similar to how people call facial tissue Kleenex, our company now says, ‘Is there a SweetProcess for that?’ They don’t say SOPs or anything—literally, that’s what I get requests for. People are going there without me prompting them to do so. That has made my life easier because I was the first line of attack,” Kevin says.
You too can transform your business operations as Kevin did. It’s okay if you don’t want to dive completely in yet. SweetProcess offers a 14-day free trial without a credit card. Sign up for the trial and see if it’s right for your business.
Business Process Mapping Symbols and Notations
We mentioned the importance of using symbols and notations in process maps for clarity. There are 27 major symbols and notations you can choose from—see what they look like and represent.
- Process: A major task

- Alternate process: An alternative to the main task or process

- Subroutine: The activities under a process

- Delay: A waiting period during a process

- Arrow: Shows the direction of the process

- Preparation: A step preceding another step

- Manual loop: Repeated automated activities

- Display: Showing information to a user

- Connector: Connection of pages in chart

- Off-page connector: The page continues off the current page

- Terminator: Point of entry and exit

- Input/out data: Entry or exit of data in a process

- Manual input: A step requiring manual input of information

- Loop limit: The highest degree of a loop

- Extract: A division of a process still running parallel

- Decision: Decision-making points

- Stored data: Steps for storing data

- Database symbol: A list of information about a process

- Internal storage: Information is available in the device’s memory

- Direct access storage: A hard drive is available

- Collate: Process for organizing information in a standard format

- Sort: To sort information in an organized way

- Merge: Instructions for merging two or more sub-processes

- Or: Indicates that a process has two paths or more

- Junction or summoning: Merging of multiple sub-processes

- Document: Steps for creating a report or document within a process

- Multiple documents: Steps for creating multiple reports or documents within a process

History of Business Process Mapping

Business process mapping was invented by Frank Gilbreth, an American industrial and efficiency engineer in 1921. He presented a paper titled “Process Charts — First Steps in Finding the One Best Way” to the American Society of Mechanical Engineers (ASME).
Gilbert’s concept was adopted by other industrial engineers such as Allan H. Mogensen who taught participants to be efficient in his work simplification conferences organized in the 1930s.
The flow process charts concept gained more popularity when two of Mogensen’s students, Art Spinanger and Ben S. Graham, adopted it in their works. Graham, who was a director at Standard Register Industrial, inculcated flow process charts in the institution’s information processing.
Gilbert’s original concept became standardized when the ASME adopted it in its ASME Standard for Process Charts in 1947.
Differences Between Business Process Mapping and Business Process Modeling
The table below highlights the major differences between business process mapping and business process modeling.
| Features | Process Mapping | Process Modeling |
| Typical Use Case | Visualize the steps for executing a task in a diagram. | Showcase the operational components of a business process in a graph. |
| Main Objectives | Guide users to understand current processes for efficiency. Document individual processes, showcasing how they work and the people who execute them. Explain business processes from employees’ perspectives. Generate qualitative workflow data such as task ownership and the correlation between tasks. Offer a subjective analysis of processes by relying on employees’ and stakeholders’ experiences. | Optimize processes for continuous improvement. Showcases how processes fit into the entire business environment in line with its operational components. Explain business processes from a managerial perspective, highlighting economic implications. Generate quantitative data such as associated costs, resources, and delivery timelines. Offer an objective analysis of processes by relying on performance data on the ground. |
Empower Your Team for Success With Business Process Mapping

Employees are the first people to blame when business isn’t moving well. Employers accuse them of not working hard enough. But if you take a closer look at the situation, you may discover that they are doing their best with the available resources.
Visualize your tasks with business process mapping and see if they won’t perform well. If the map is readily available and accessible, they can always refer to it for guidance. It’s almost impossible for them to underperform.
Business process mapping also has a psychological impact on workers. Having clear instructions to deliver great results boosts their self-esteem and confidence. This positive disposition will have a ripple effect across your business. Kickstart this personal and organizational transformation by signing up for a 14-day free trial of SweetProcess without a credit card.
